AI, Data Centres and Copper – some notes
Data, charts and quotes in this post from various sources on the internet. Please regard the following for directional reference only.
CONTEXT
To understand the world of minerals and metals for say, the last 50 years, one could say that the traditional demand driver has been core economic growth led by a) manufacturing, b) urbanisation and d) infrastructure growth at different pace around different regions of the world, all resulting in a high demand for metals across the globe.
One could also say that the following systemic accelerants are now changing the traditional demand patterns for some of the core minerals & materials:
- Energy transition (renewables & electrification)
- EVs & battery
- AI & compute (electricity‑centric) – explored in this post
Given this context, following are some notes on AI, Data Centres (AI core infra) and Copper (one of the most affected metals).
AI – LANDSCAPE
AI – “At its heart is software code that learns by reading massive amounts of data and finding patterns. The model then processes those patterns to make predictions based on its learning. These two steps are more generally known as training and inference. ” – Brookfield report
This is different from past computing in the way that it generates responses rather than just retrieving saved responses. It does so through a lot of computing power, generating tokens (units of data). “LLM inference is dense matrix compute that scales with tokens and model size.”
In a way, AI is akin to infrastructure development – something as basic as utilities. And it reshapes the sectors and businesses it interacts with, the way any new infrastructure does.
To get a sense of AI usage around the world, consider the following:
- AI usage can be both for training purposes and inference (usage) purposes. Although training models are becoming larger and more complex, the long term burden comes from inference/usage – the everyday use of these systems. (inference estimated to be 75% of growth by 2030 from current minority share of total AI compute)
- ChatGPT number of queries – 2.5 billion a day. (ChatGPT by far is the largest in query volume, hence a good proxy to understand the space).
- As a comparison, Google processes over 13 billion searches a day. This used to be 3 billion a day in 2015. Hybrid modes with AI-overviews these days blur the line.
- It is estimated that AI tools use 10 times energy than search engines like Google
- ChatGPT has ~700-800 million active weekly users. Google has over 5 billion users globally.
Perhaps here, let’s mention Jevons Paradox, which applied to coal, to electricity and now is expected to apply to AI too:
“Jevons Paradox: This theory, named after economist William Stanley Jevons, suggests that the increasing use of a resource (e.g., electricity) can, paradoxically, lead to even more consumption because efficiency gains often lower the resource’s cost and increase its attractiveness.”
AI – INFRASTRUCTURE & BUSINESS
In the physical world the primary repurcussions are felt as Data Centres, increased power usage by data centres (the key processing area for AI), the chips that make AI possible, and the resources that are used to make the chips, power and data centres. But before looking at what AI means for the physical world (the world of substations, copper mines, grids and data centers), here’s a quick look at the layer-cake analogy of AI business models.
Layer cake analogy shared by Jensen Huang, Nvidia Founder:
| Applications |
| Models |
| Infrastructure |
| Chips |
| Energy |
Once available as models for usage, the effects of AI are felt across all kinds of businesses and sectors. At the application levels, AI is closer to a feature rather than a business. The effect is felt beginning with the companies providing the models as service, to applications developed on it, and further to each business that uses AI – be it in the physical world (from hospitals to utilities to cities to cars) or the digital world.
Since AI reshapes businesses, the way infrastructure does, it implies that beyond the lower layers of infrastructure, chip and models, the value will be generated in existing businesses – in their increased profitability, cost efficiencies or valuations over time.
DATA CENTRES
Data Centres are used for ‘traditional’ purposes of web hosting, storage, email, cloud and the ‘new’ purposes of AI Compute. At the moment it is estimated that AI uses ~5-15% of data centre power, but in a few years, it will be close to 35% if not more. At the same time, the capacity of Data Centres is set to increase significantly. Consider the following pointers:
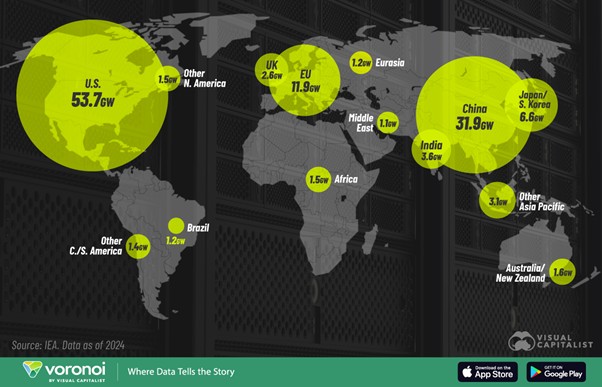
- There are overall around ~12k data centres around the world, but the best way to measure their capacity is in Gigawatts (GW) or Terrawatt hrs used per year (TWh/year), same as electricity. It is estimated that globally around ~114 GW (~415 TWh of electricity consumption in 2024) of data centres at the moment (US and China account for ~70% of this installed capacity). And this capacity is set to reach 200 GW (~945 TWhrs) by 2030.
- To put this in context, Global installed total power/electricity capacity is estimated at around 9,090 GW (c.2023). This implies over 30k TWhrs. Data centres use around 1.5% of global electricity (but have grown over 12% pa over the last five years).
Even though to the overall global power demand, AI demand/ Data Centre demand is a small part, but it is a large part of the increase of electricity consumption. Moreover, it has a large impact wherever it is because it is a step change in power demand rather than a gradual increase of a town or a city.
An average hyperscale data centre has a capacity of 100-300 MW (1-2.5 TWh/ year). A city of 100k people can consume 1.2 TWh per annum. Electricity is not really the bottleneck, it is perhaps the grid infrastructure. It is like scaling a decades’ long growth of a town in a compressed project within a year or two. Some sources estimate that the grid infrastructure upgrade can take upto 10 years.
A few charts to understand the above better:
a) Following from VisualCapitalist showing current Data Centre capacity around the world.
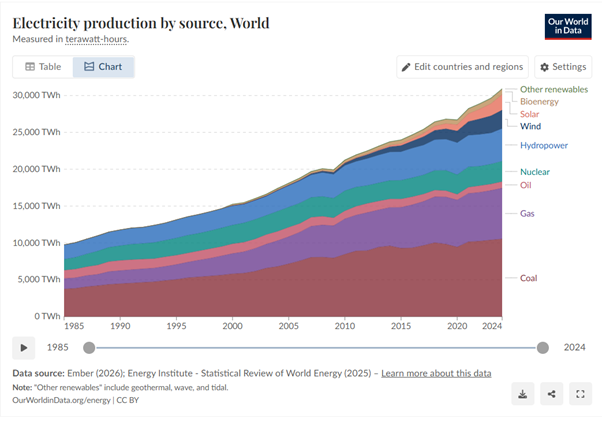
b) Following from Our World in Data showing the total electricity production around the globe. Consider the growth over the last 40 years (trebled). And it is expected to increase by 50% by 2040.
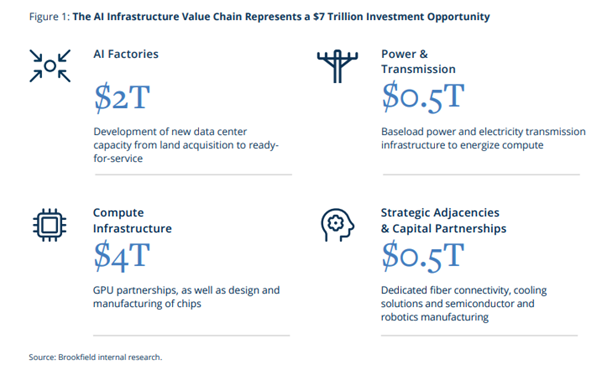
c) AI infrasture investment opportunity – As per Brookfield
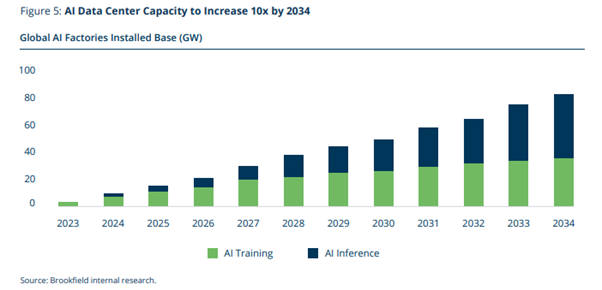
d) The following chart gives a good sense of how AI installed base is projected to grow.
RESOURCES – for instance, COPPER
For the purposes of AI, both Data Centres and Electricity grids give rise to more demand for Copper. Following are a few pointers to understand the Copper market.
- So far, the world has produced 700 million tonnes of copper and there are known reserves of 2.1 billion tonnes.
- Global copper demand is ~28-29 million tonnes annually while the annual production is ~23 million tonnes. Part of the demand is met by recycled copper.
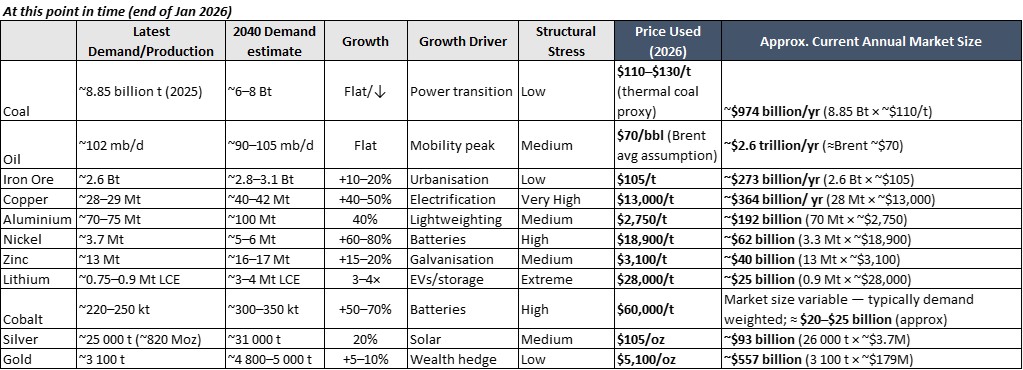
- To set these figures in context, aluminium annual production is ~70 million tonnes, while gold is ~3300 tonnes, silver is 25k tonnes. On the other hand, steel production is 1.9 billion tonnes annually, and amongst metals, iron is the largest by a magnitude difference.
- Value-wise, copper is usually the third largest metal after iron ore and gold in global markets, but at the moment (Jan 2026), it is second largest, larger than iron ore. In terms of overall resources mined from the earth though, coal and oil are the largest, and the ones directly consumed, while most of the metals grow with infrastructure, construction and industrial growth.
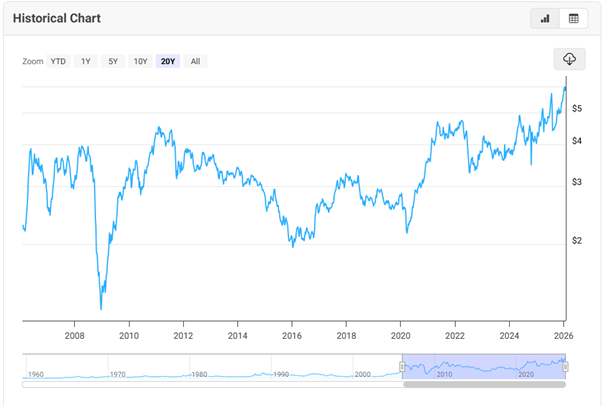
- Copper prices are at an all-time high at the moment. Given its demand growth from grid investments, EVs, renewables, and now increasingly Data Centres, copper prices reflect the effect.
- Data Centres are just a small part of the overall demand, it is the traditional demand of general grid investment, the increasing electrification which drives the demand up, and given the tight supply affects the prices.
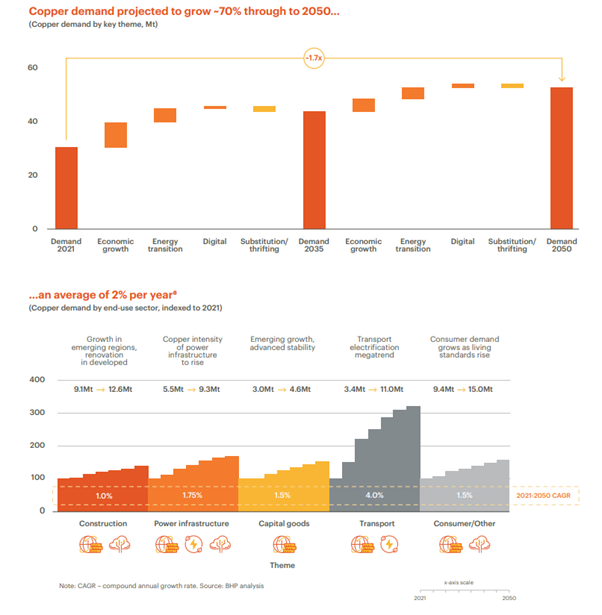
“Global copper demand is projected to rise 50% by 2040, growing from 28 million metric tons today to 42 million, driven by four vectors: core economic demand, the energy transition and addition (renewables, EVs, grid expansion), AI and data centers, and defense modernization” – S&P report.
Following is a price chart for copper:
“Without improvement in above ground risks and significant new investment, a 10 million metric ton supply shortfall is projected by 2040…Average copper mine takes 17 years from discovery to production, with much time spent on permitting, environmental reviews, and community consultations” – S&P report
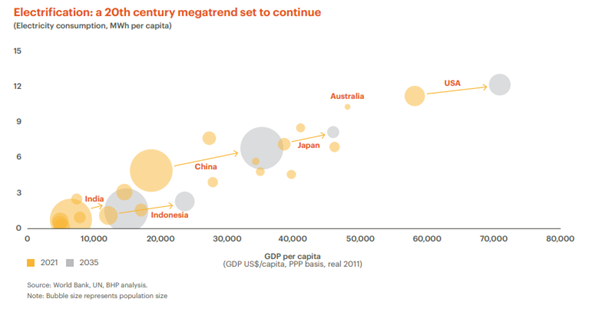
Following two charts from BHP show the electrification trend continues, and how energy transition and digital infrastructure continue to shape copper demand through the coming decades.
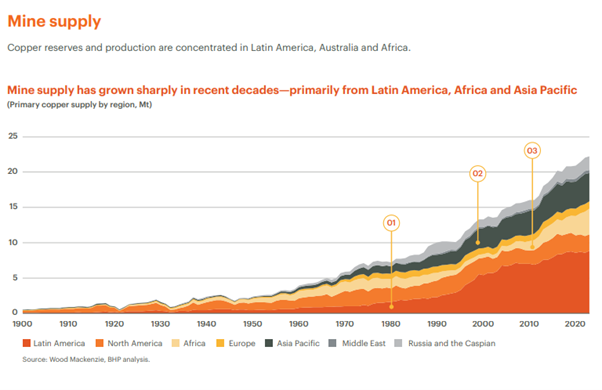
Another enlightening chart is the following, just a reflection on how we mine the Earth, and how modernity is slowly covering the globe. Until 1960s, it used to be sub 5MT extraction per annum. At the moment, it is upwards of 20 Million tonnes new mined every year.
Later (Mar 10, 2026) – I worked on the above page. But building further from above, here’s a first cut deep dive done by AI on the AI hardware market, mainly chips. Read on, if for nothing, then to be fascinated as I am by the AI prowess these days! Although the rate of human processing of information still doesn’t change, the rate of creation has surely changed.
Some interesting links/reports :