The following post draws from the book and this report on inequality.
We live in an unequal world. One of the arguments in the book is that this inequality could be perhaps more acceptable at levels of say, one is to five, or one is to ten. But at the current levels, at times, worse than one is to hundred, the world is very lopsided and unsustainable.
Some notes and charts from the book to think deeply about.
Systems change. It is not forever like this.
One of the thing he talks about is historical amnesia. We forget the recent past, and how countries behaved then. Case in point is writing off debts in mid twentieth century. The obverse angle to this is that systems change, and they can change pretty rapidly. Case in point is Sweden.
Systems change pretty rapidly. Sweden is a case in point.
“All the countries in Europe were extremely inegalitarian, with Sweden intermediate on the spectrum between France and the United Kingdom. It was long one of the most stratified countries in Europe, highly sophisticated in the political organization of its inequality.
This situation changed very rapidly in the second third of the twentieth century, in response to a concerted social and political effort, after the Social Democratic Party came to power in the early 1930s. This party, which then governed continuously for the next half century, put Sweden’s governmental capacities toward an entirely different political program than had existed before. Sweden thus provides an interesting case, one that should inoculate us against any belief in long-term determinism, according to which certain natural or even cultural factors might make some societies forever egalitarian while making others forever inegalitarian.
Sweden’s example is interesting, because it shows that a country is never inegalitarian or egalitarian by nature. In fact, reality is highly changeable and always being rebuilt: it is the product of power relations, institutional compromises, and partially explored forks in the road.”
Inequality of Income and Wealth
Income is what one earns and wealth is what one owns.
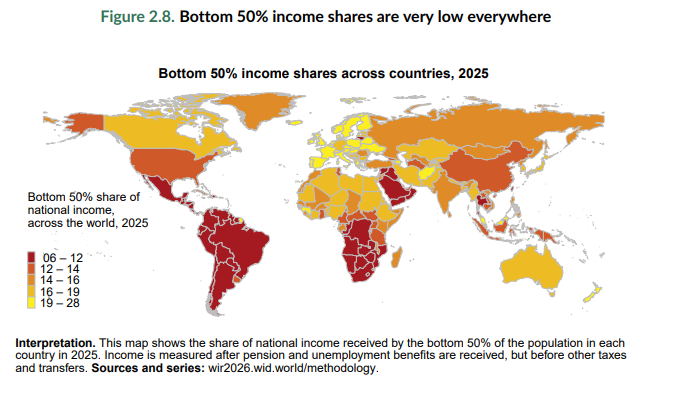
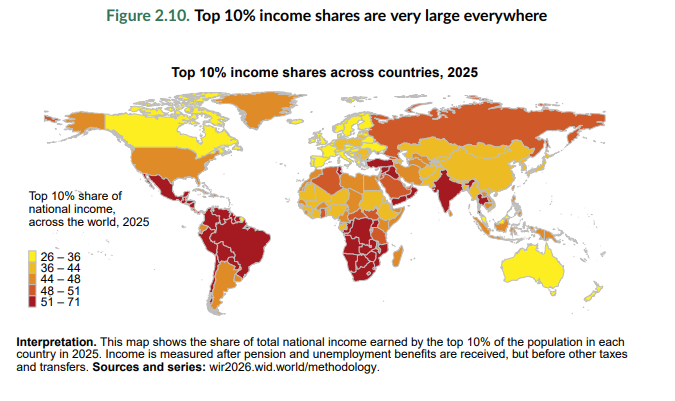
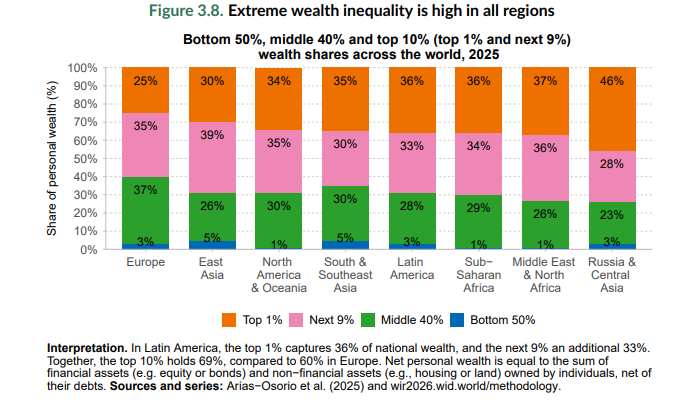
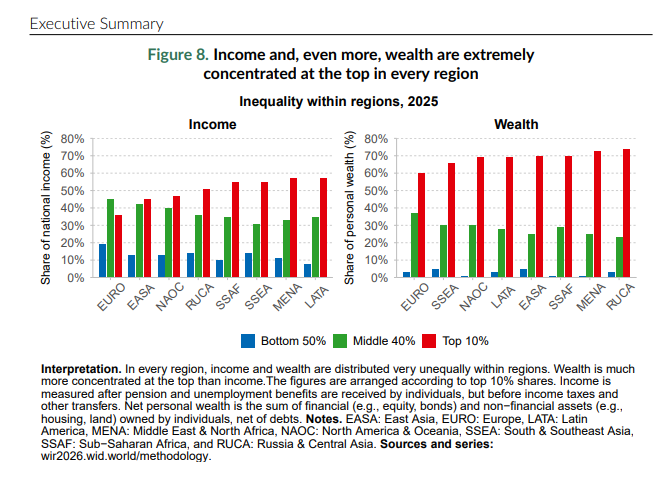
In the case of revenue, the share going to the richest 10 percent varies from 25 to 70 percent, depending on whether we’re looking at Sweden or South Africa. In the case of wealth, the share of the richest 10 percent is between 60 and 90 percent no matter where we look. At the other end of the spectrum, the poorest 50 percent, who received from 5 to 25 percent of income, do not own more than 5 percent of total wealth in any country on earth.
Consider the following five charts. First two refer to the world income share in different countries going to bottom 50% and top 10%. The third chart is mind boggling in the distribution of income and wealth. And the fourth chart shows how extremely few people own most of the wealth in the world. The fifth chart further details the wealth distribution across regions. The whole world is inegalitarian in terms of wealth.
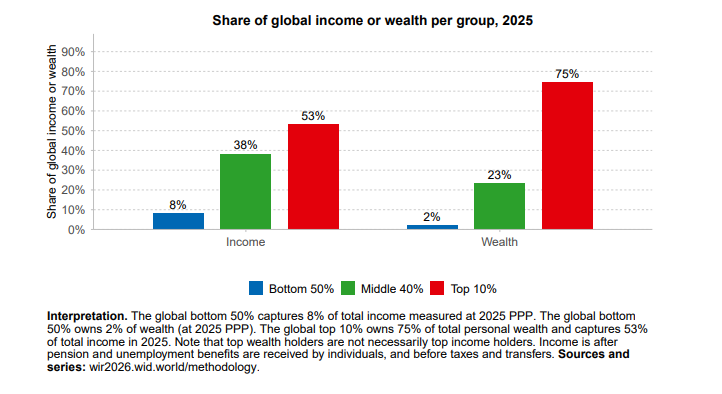
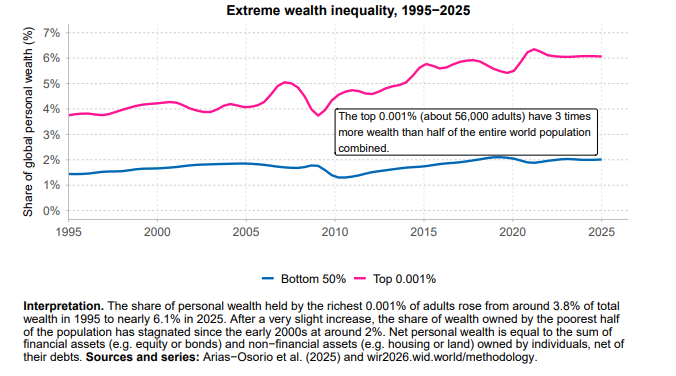
The inequality of income across the world perhaps gets magnified as inequality of wealth. Perhaps the richest have more than enough income to convert to wealth while the poorest do not have enough to subsist, saving and creating wealth becomes a far cry. This not just affects the quality of life directly, but their freedom and power as well.
Global wealth has grown far faster than income since the mid-1990s, rising from just over four to more than six times world income. Almost all of this increase sits in private balance sheets: private wealth climbed from roughly 260 to over 430 percent of world income, while public wealth stagnated at around 80–90 percent and turned negative in some regions. East Asia is the exception, with substantial and rising public wealth. In parallel, the share of income allocated to capital has increased, while labor’s share has declined, thereby reinforcing private asset accumulation.
Further, following quote from another source, Our World in Data, about inequality:
“In 1800, only a few countries had achieved economic growth while the majority of the world still lived in poverty. In the following century, more and more countries achieved sustained economic growth, and the global income distribution became much more unequal: there was a clear divergence between early-industrialized countries (where extreme forms of poverty were virtually eradicated) and the rest of the world. In the following decades and up until today, early-industrialized countries have continued growing, but the biggest changes have taken place at the bottom of the distribution. Today, global income inequality is lower than it was in 1975. But still, despite the ‘catch-up growth’ in recent decades, our world today is both much richer and more unequal than it was in 1800.” – Our World in Data
Gender Inequality
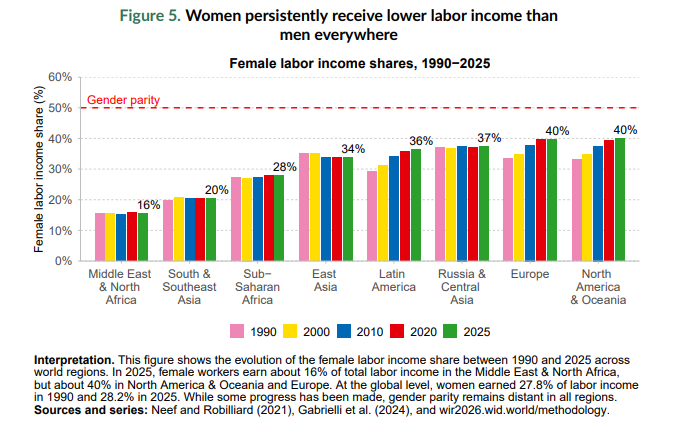
A short note. Without going into the debate about pay, this chart just summarises a simple metric of total income of women from work.
“we subsequently developed a fairly simple metric for gender inequality: women’s share of total income from work (salaries and income from unsalaried activity). If there were perfect equality, that number should be 50 percent. What we see in practice, however, is that their share falls far below that number.”
From a time, when right to vote was not universal but linked to wealth and property thus naturally excluding women and the poor and most of the world, to the modern universal suffrage has been a journey indeed.
What stands out is that prior to 1970, women were almost excluded from the monetary system and had very little buying power unless one considers household wealth. It has to be noted that there has been significant changes in the world from where it was, and if the trajectory continues, the gap should narrow further.
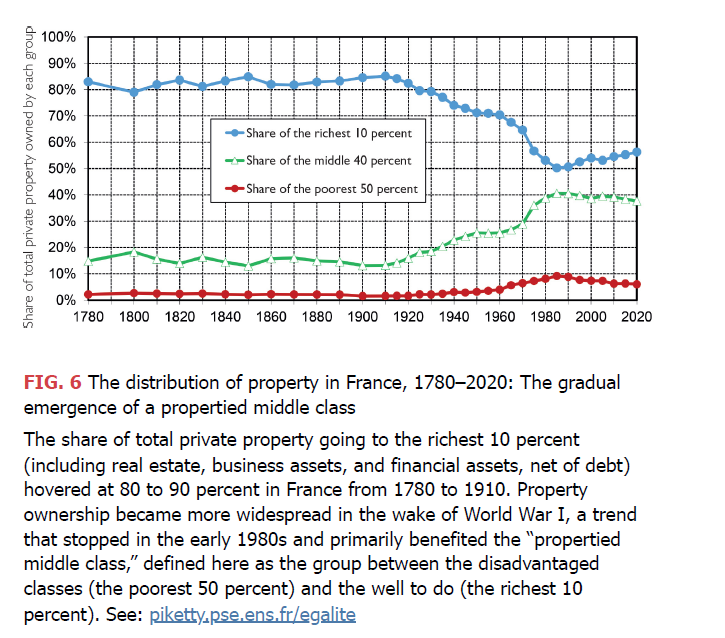
Emergence of Property Owning Middle Classes
This is a considerable event, economically, socially and politically. And most of this has happened in the last 100 years.
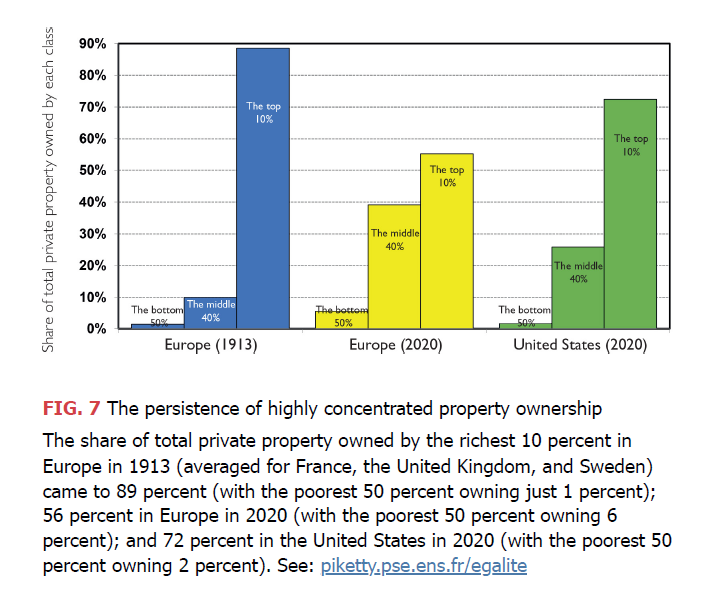
These 40 percent, who are neither the richest 10 percent nor the poorest 50 percent, owned practically nothing until 1913 and were thus almost as poor as the poorest 50 percent. There had been no middle class. Today, this group owns 40 percent of the total wealth of Western Europe and represents 40 percent of the total population. These are people who are not enormously wealthy but who are far from being truly poor and who resent being treated as such. The emergence of this group is a considerable event—economically, socially, and politically—even if access to wealth remains practically nil for the poorest 50 percent.
Consider the example of Europe, and especially France through the following charts.
This is happening across the world as well, and this implies a rise of the classes which are neither extremely rich, nor extremely poor, but sit in the middle. This middle group is an emerging nuance in wealth and income distribution and has economic, social and political repurcussions.
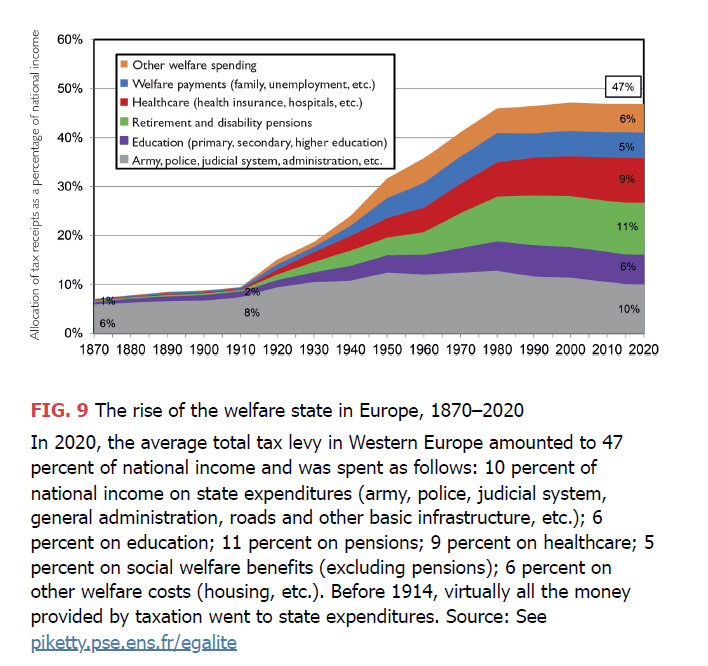
Emergence of Welfare State
To counter inequality, a government has to think of externalities, has to think outside the logic of markets and capitalism. This pointer about state’s increasing investment in public goods such as education, healthcare and infrastructure. This investment by State is considered to be one of the most powerful equalizers per the author. But access to these services still remains ‘uneven and stratified’ exacerbating the existing inequalities.
This investment has been funded by taxation, and according to the author, progressive taxation,
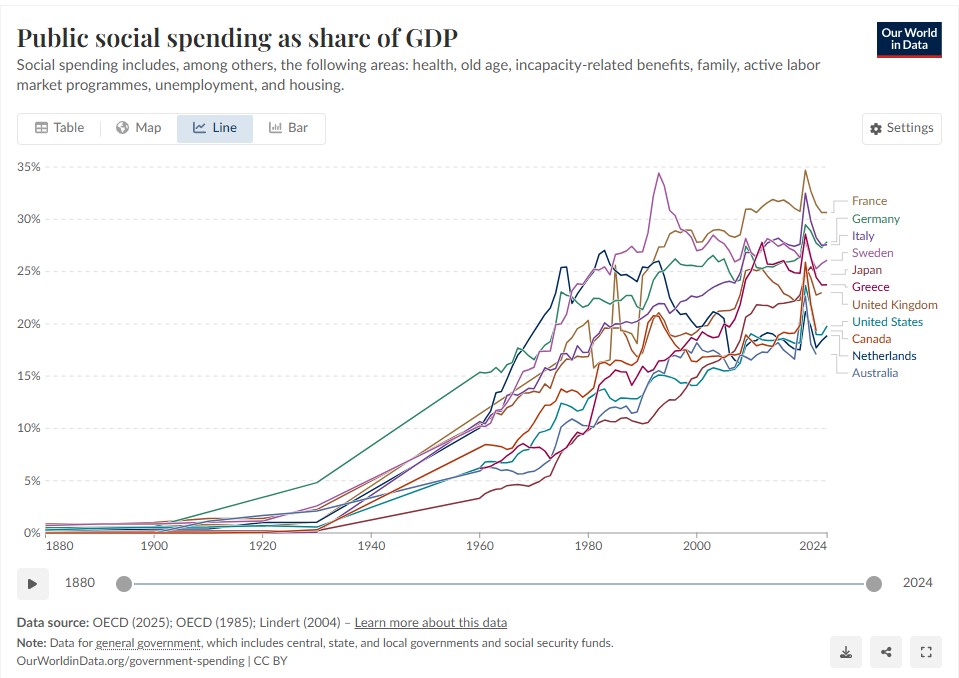
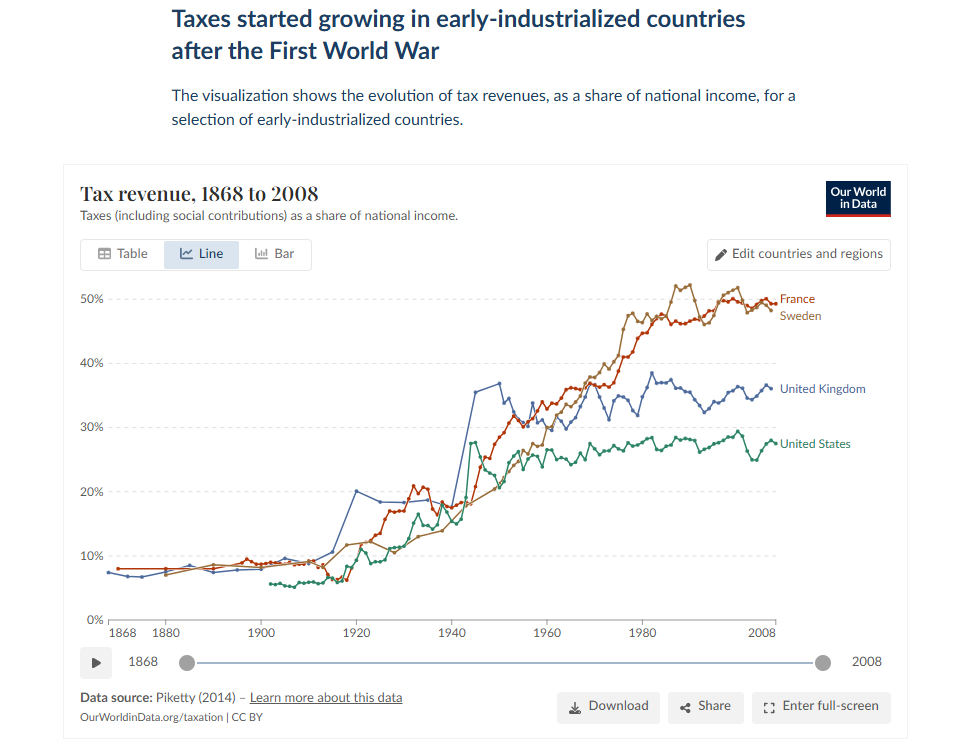
To complement the above, consider the following chart from Our World in Data – a historic perspective on how this spend has shaped.
“The point we want to emphasize is that the world economy has changed in many ways in the last two centuries; and while globalization has been a key factor contributing to raising living standards across the world, its positive effects have been modulated by public policies, particularly social transfers.” – Our World in Data
Taxation is a relatively new way to governments income. Prior to the world wars, colonial assets provided significant income to the colonial powers.
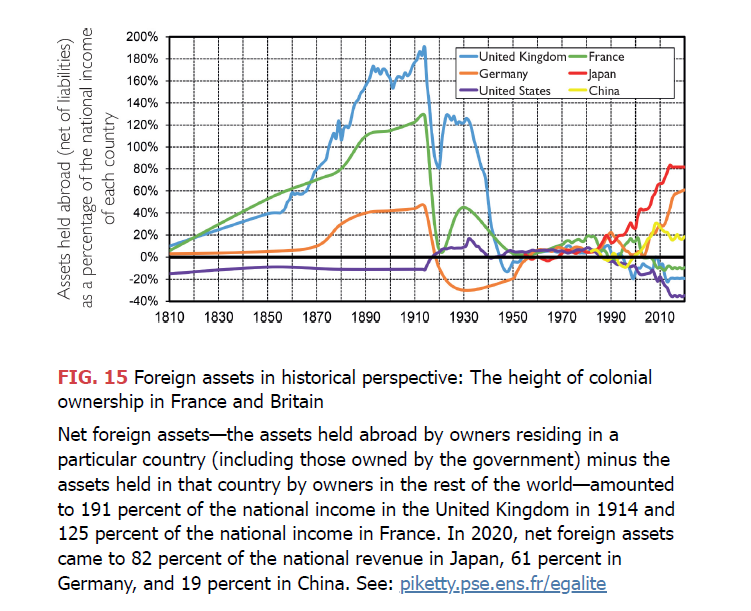
But for the last 100 years, taxation income has helped fuel the government and for states choosing to spend it on welfare, the outcomes go towards better quality of life for the population, and a step towards reducing inequalities.
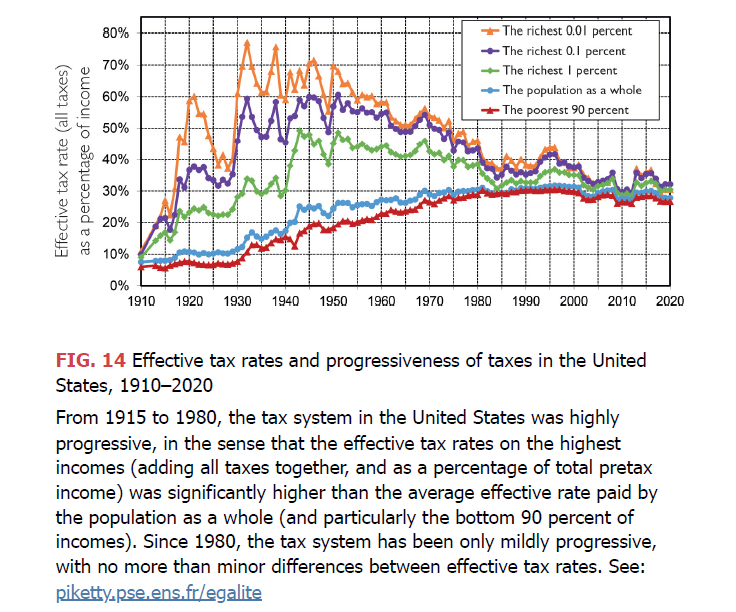
One of the points he talks about how there’s been a change since 1980. From 1914 to 1980, taxes were progressive and allowed the burden to be shared across the board, it allowed the welfare system to be built. But from 1980, in America, top tax rates were cut (Tax Reform Act of 1986).
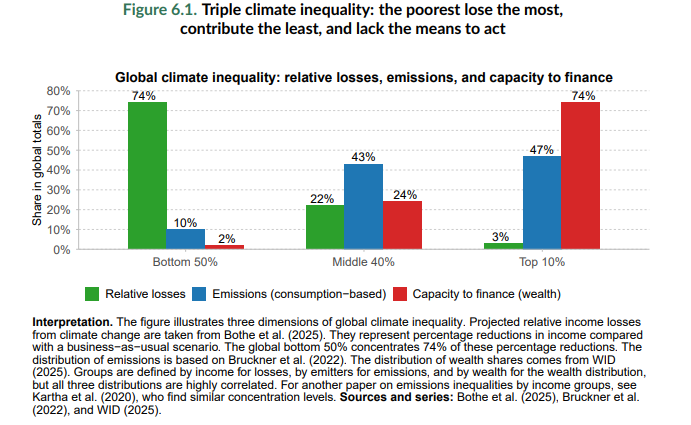
Nature and Inequality,
As to this point, I’ll perhaps add this chart from the report here which speak volumes:
This perhaps is read well in conjunction with the post on Ghosh’s ‘The Great Derangement’.
Finally,
“Inequality is a political choice. It is the result of our policies, institutions, andgovernance structures. The costs of escalating inequality are clear: widening divides, fragile democracies, and a climate crisis borne most heavily by those least responsible. But the possibilities of reform are equally clear. Where redistribution is strong, taxation is fair, and social investment is prioritized, inequality narrows. The tools exist. The challenge is political will. The choices we make in the coming years will determine whether the global economy continues down a path of extreme concentration or moves toward shared prosperity.”
This one is a short book, and worth a read. I am yet to read Piketty’s larger books, but this short book summarises his work and arguments on inequality beautifully.
All the charts above and the quotes are from the book and the linked report unless otherwise mentioned.