
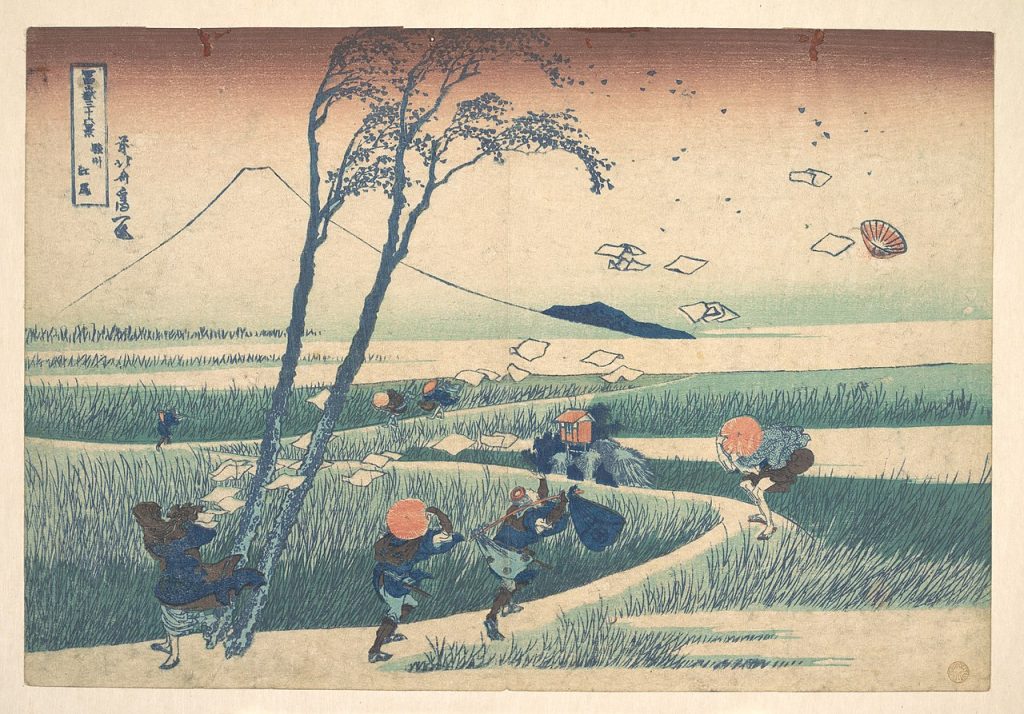
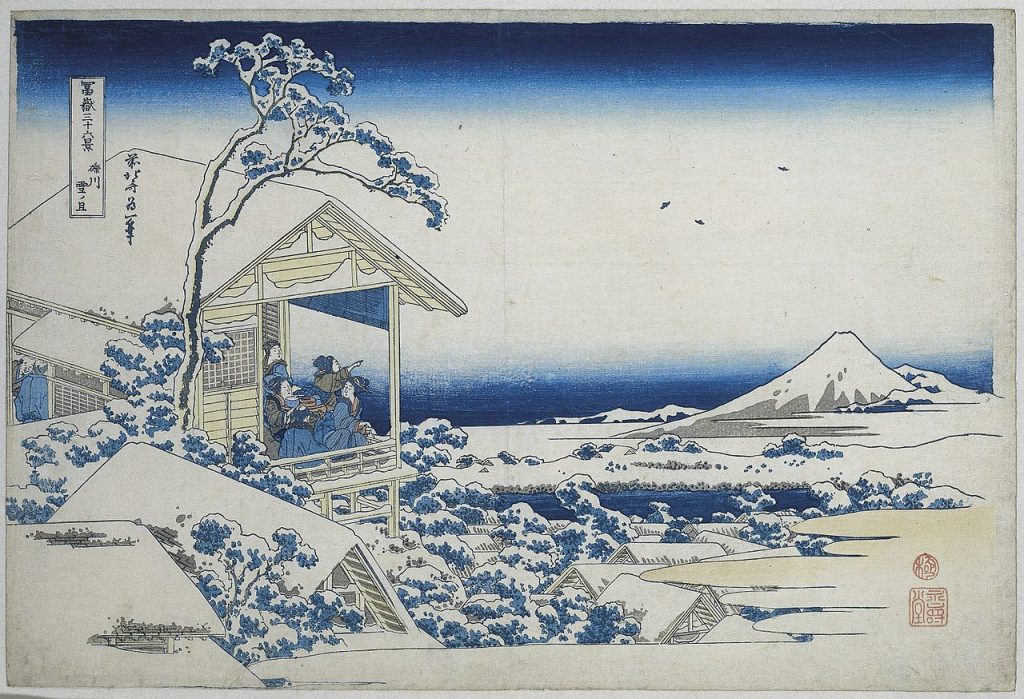
Thirty-six sketches of the world, through the brush-strokes of Japan.
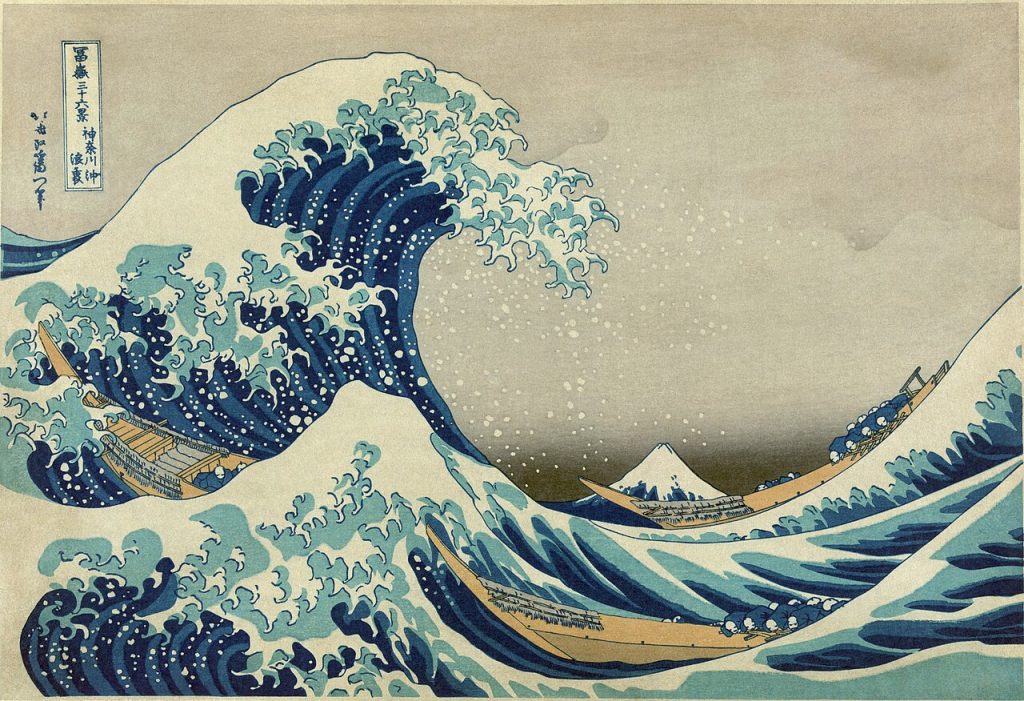
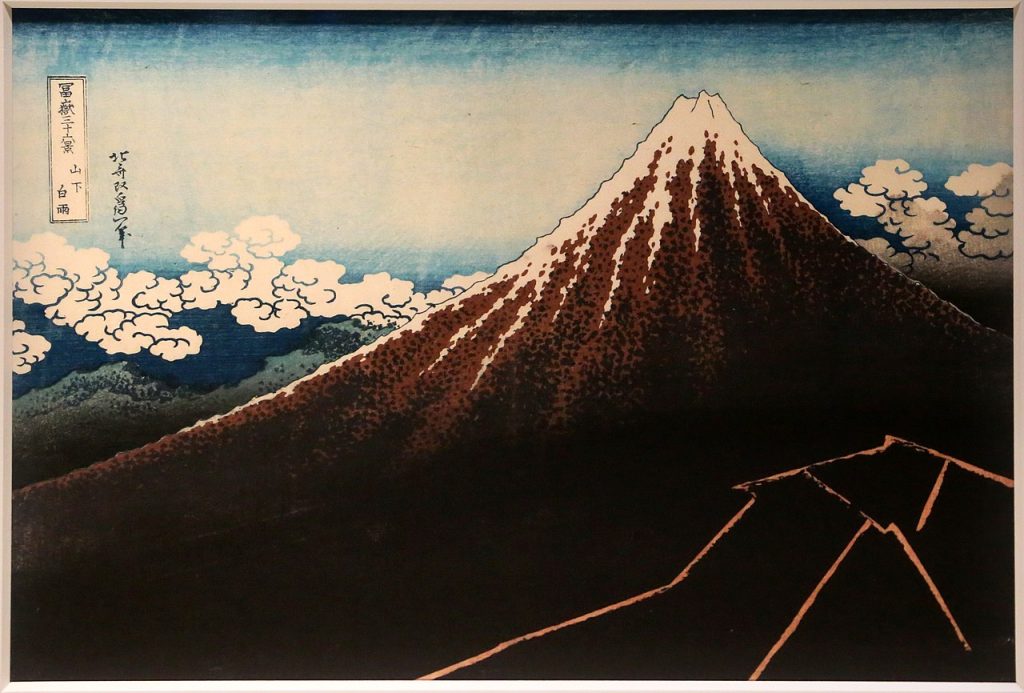
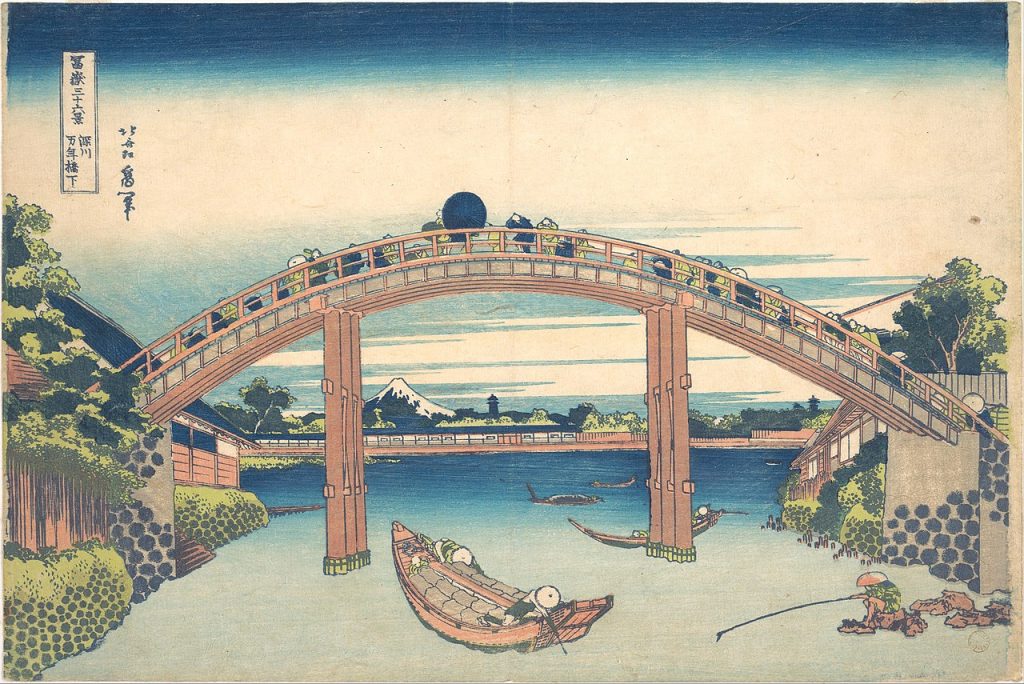
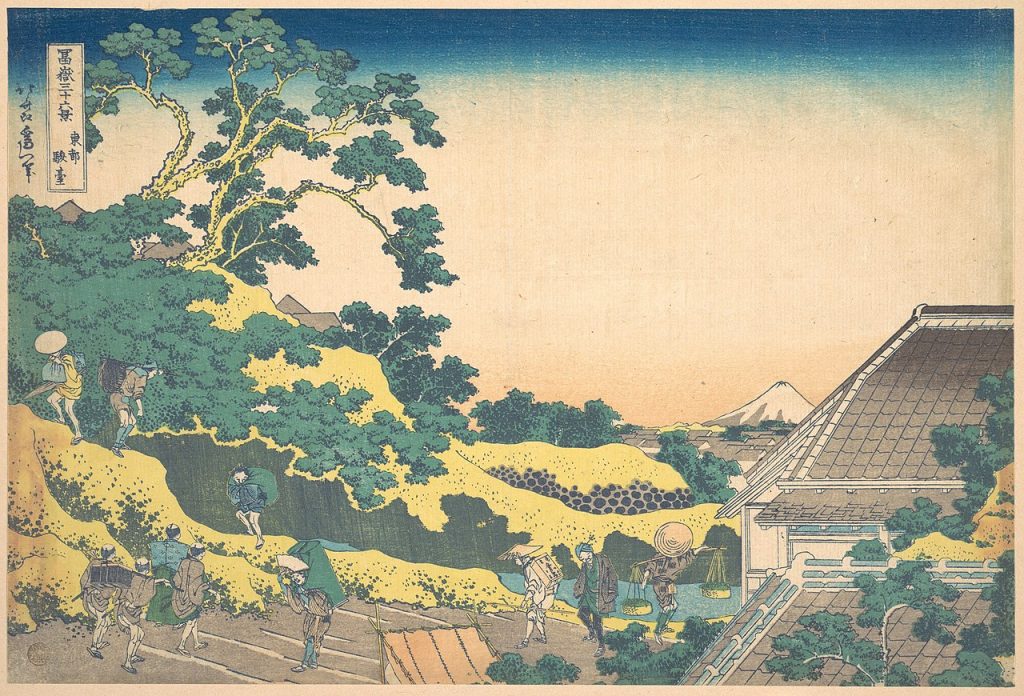
We took a holiday in Japan in November. Our first family trip to Japan – much awaited destination and much awaited vacation. Inspired by Hokusai’s Thirty-Six views of Mt. Fuji and my general curiosity and keenness to understand Japan through numbers, here are thirty -six short notes on Japan.
(All the numbers data is generally directional. Different sources sometimes show different numbers for the same parameter. Please do allow for margin of error and refer to the following only for broad brush understanding.)
The images are copied from Wikipedia.
All currency ($) referred is USD unless specified.
***
1. Population
Japan has a population of 124.5 million people. In 1800, Japan was 30 million people when the world was 1 billion people (fairly significant). In 1900, it was 44.3 million people, when the world population was around ~1.6 billion people. And in 1950, it was 83.2 million people, when the world population was 2.5 billion people. In 2010, it peaked at around 128.1 million people when the world population was 6.7 billion. Since then, the population in Japan has been declining. Japan’s fertility rate currently stands at 1.37.
On average there is a decline of 448k every year. At this rate, it is expected that by 2050, the population will perhaps drop to 105 million.
At the moment, it ranks number 12 in the world by population. The largest at the present times (Jan 2025) is India with 1.45 billion, and next China with 1.42 billion. In terms of developed countries, US is the third largest globally with 345 million people, followed by Indonesia with 283 million people and Pakistan’s 251 million people. Next is the largest African country in terms of population, Nigeria with 232 million people, followed by Brazil’s 212 million people. Bangladesh (174 million people), Russia (145 million people), Ethiopia (132 million people), Mexico (130 million people) are next few before Japan’s 124.5 million people. (Data from different sources – numbers for directional sense only). For reference, the population of the entire globe is close to ~8.2 billion people.
It is interesting to note the number of people residing in Asia – esp South Asia (~2b) and SE Asia (~700m) apart from China(1.4b). Then again, one understands where US is given both its size of population and the development levels of that mass of people. Next to that size in developed nations is only Japan, and that is a different story. If you were wondering, in terms of Europe, Germany is the largest with 85 million people, followed by UK’s 69 million, France’s 66 million and Italy’s 59 million.
2. Land Size & Population Density
Japan is 378k square kilometres spread across ~14,000 islands, with 4 main ones (Hokkaido, Honshu, Kyushu, Shikoku), others being called remote islands. 81% of the population lives on Honshu, where Mt. Fuji is also located. (Interestingly, until a few years ago, the number of islands was supposed to be ~7,000, but now the count has moved up, although area remains unchanged).
Japan is the 4th largest island country in the world. The largest being Indonesia (over 5 times size – 2 million sq km, over 2 times population). Next is Madagascar and third largest is Papua New Guinea.
In terms of a comparison with the world’s largest countries area-wise, Russia has around 17 million square kms. Next, Canada, China and US each has somewhere between 9-10 million square kms.
With population density of 326 per square kilometre, Japan is the 12th densest country (in countries over 10 million people). And 4th densest if one were to look at population over 100 million. (Bangladesh, India, Philippines would be the top 3).
Just as an extreme, I would like to compare it to New Zealand, another island nation and a developed country loved by tourists. Where NZ has 270k square kms (70% of Japan’s size), it has only 5 million people in that area to Japan’s 124.5 million. The other comparison is perhaps with UK. With 245k sq km, it is smaller than Japan (65% of Japan), and has ~68 million people living on it (or close to half that of Japan).
3. Urban-Rural understanding
Migration to towns and cities is a very recent human phenomenon – mostly unfolding over the last 200 years. It is estimated that in 1800, <3% of the world’s population lived in cities. If one were to perhaps consider this that in 1960, roughly only a third of the world population lived in cities, the starkness of this phenomena – of how the modern human lives becomes apparent. 2007 marked the year when total urban population surpassed total rural population globally. It is now ~56%, or c. 4.4 billion people live in cities. In the developed world, this number is close to 80%.
“Urbanisation is an unavoidable consequence of modernisation.” Over 80% of global GDP is now generated in cities.
For Japan, 93% of Japan population is urban population. In contrast, 82% of the US is urbanised, 84.4% of the UK is urbanised, 81.4% of South Korea is urbanised. China is 66% in urban areas at the moment. Japan is one of the world’s largest countries that way in terms of proportion of urbanity.
Japan started to urbanize in 1920s, and was over 50% urbanised in 1970. Between 1920 and 1980, the urban population increased from 10 million to 89 million, from 18% to 76% of the population. So perhaps here too, it is the last fifty years that have seen this growth to over 90%.
As a comparable number, Japan was 50% urbanised in 1970, North America was over 50% urban in 1925. And Europe was over 50% urban by 1950. The other country to consider is South Korea (51.7m pop), which was 28% urbanised in 1960, and was over 81% by 2018.
Although one staggering indicator here is Brazil with 87% urban population. For a developing and relatively large nation (212 million pop), it has a high proportion of urban population. Since 1970s, Brazil has consolidated itself as an urban country. Argentina, another South American developing country has 92.5% urbanisation.
A little point of reflection:
“Advancements in agricultural practices and technology then coincided with the beginning of the industrial revolution in Europe in the late 19th century, which resulted in waves of urbanization to meet the demands of emerging manufacturing industries. This trend was replicated across the rest of the world as it industrialized over the following two centuries, and the most significant increase coincided with the industrialization of the most populous countries in Asia. In more developed economies, urbanization remains high even as economies de-industrialize, due to a variety of factors such as housing availability, labor demands in service industries, and social trends.
Urbanization in the future represents an important determinant of the world in the future. The reason is that urbanization means the transition from agrarian society, characterized by the cultivation of land and self-supporting, to industrial society, characterized by dominant people living in urban sector with employment in non-agrarian work sectors. Urbanization, accompanied by modernization of labor pattern and lifestyles, has a significant impact on human behavior and consciousness, and results in the transition to an extremely urbanized society never before experienced in the past.”
4. Cities
Not just urbanised, Japan’s population is concentrated in a few cities.
“The population of the wider metropolitan area in which Tokyo is situated is approximately 40 million people. The continuously urbanised Tokyo commuter zone has about 35 million people. The official Tokyo local government area (i.e. the prefecture, or TMG) has 14 million people and the ’23 Special Wards’ of Tokyo contain just under 10 million people.”
So just under a third of the country resides in Tokyo. And yet, when one travels through Japan on trains, at least wherever the tracks go, they seem to be generally surrounded by houses.
Tokyo can be considered one of the largest cities in the world, or perhaps the largest. But considered that way, according to encyclopaedia Britannica, Guangzhou China has a population of 70 million, larger than most (except 20 countries) in the world. As a comparison, New York is 22 million people.
Not many developed countries in the world are centralised like this in one or two cities. But there are countries like Mongolia, Paraguay, Uruguay, Liberia and Armenia where more than half of the country’s urban population live in its largest city.
Osaka, another Japanese city has over 17.7 million people in its urban network.
One has to keep in mind the following comment from Britannica on cities while considering these numbers
“But, what defines a city? When you are comparing developments with tens of millions of people located in countries across the globe, a unified definition is tricky—one needs to consider a variety of population groupings, including urban populations, consolidated urban areas, agglomerations, and conglomerations. However, all these groupings have one thing in common: they feature a central city surrounded by contiguous settlements of people.”
By 2050, close to 7 billion people in the world are expected to live in urban areas. (Of a total expected population of 9.8 billion).
5. Age distribution
One of the often-discussed features of Japan is its ageing population. 30% of people are 65 years or older implying 36.65 million are seniors. For context, in 1960, this was 5.8% of the total population or 5.5 million then. Along with becoming highly urban, Japan has also aged.
“Demographers issued their first warnings in the 1970s and a national debate erupted in 1990 with the “1.57 shock,” when the country’s birth rate fell to its lowest level in recorded history. (The rate has since gone lower.)”
The current birth rate in Japan is ~1.26 births per woman. For the world, this is 2.3.
The median age of Japan is 49.5 years old. In certain ways, this is one of the highest in the world.
For the entire world, around 10.12% of the population is aged 65 and over. The world median age is 30.6 years. In 1974, the global population over 65 was 5.5%, the proportion doubling to over 10% at the moment and expecting to double again by 2074.
In terms of people 65 years or older, China currently has over 200 million people in that age group, India, some 85 million people, and the US, around 58 million people. What makes Japan different is the distribution. Amongst the larger countries of the world, it has the highest proportion of seniors, or perhaps it is the “grayest”. It is one of the effects of its declining population as well.
Although the overall population in Japan is declining, yet, interestingly, the working population in Japan is increasing. Both – female participation and older people participation in the work force is increasing. At the moment, 68.14 million people are employed in Japan (which is the highest ever), 37.06 million men and 31.08 million women. “Employment of people aged 65 and above has doubled from about 4.5 million in 1995 to more than 9 million today.”
And compared to early nineties where ~57% working age female were participating in labour force, now close to 75% do. This change of women participation in workforce is bringing about other changes too in terms of family attitudes and responsibilities.
“Global demographic trends marked by transitions to low levels of fertility, smaller families and ageing populations, as well as increasing urbanization and international migration, are changing the household contexts in which people live.”
“Japanese family structures have been influenced by Confucian ideas of filial piety and defined hierarchical social relationships over the centuries.” And yet, Japan has over 55.8 million households. Massive demographic changes have significantly affected the traditional family structures.
The average household size is 2.25 in Japan. This is 2.6 in the US, 2.98 in China, 4.44 in India. Some of the sub-Saharan and West Asian countries have quite large households (6-8 people on average). But most of the developed world is in the 2 -3 range.
6. GDP
Japan’s GDP in 2024 is estimated at $4.1 trillion. This makes it the world’s fourth largest economy. Until 2022, Japan used to be the third largest economy, ahead of Germany.
In 2012, Japan reported a $6.2 trillion in GDP. At the moment, Germany is $4.6 trillion. But of a completely different magnitude is the world’s largest economy, USA at $28.8 trillion, followed by China at $18.5 trillion. India is fifth largest, at $3.9 trillion. The entire global GDP is around $110 trillion implying USA contributing close to a quarter of global GDP with ~4.1% of the world’s population. This is where USA is perhaps leagues apart from any other country in the world.
In terms of per capita GDP, Japan stands at $46,300 per capita (or $53.06k at PPP). For comparison, USA per capita GDP is at around $86,600. China at around $12,970 ($26.31k at PPP).
In terms of growth, after the Second World War (WWII), Japan saw growth of over 10.1% on average p.a. during the 1960s, then 5.2% in 1970s and 4.6% in 1980s. The period from 1955-1973 is often referred to as Japanese Economic Miracle for the unprecedented levels of growth. For a country not very rich in resources, this was quite a high growth.
But since 1991, what is now called ‘Lost Decade’ began in Japan with the significant fall of asset prices. The economy then grew at an average of 1.4% for a while. It took Japan around 12 years to reach back the GDP levels of late 1995. After this decades-long stagnation of sorts, even now, although the economy is growing, other demographic features make sustaining the growth difficult. Over the last 10 years, the CAGR is 0.8%, but over the last 3 years it is 1.9%.
At the moment, one of the key priorities for Japan is to find the best way forward with its current demographic mix, to harness this high dependency ratio economy back to growth through this whole new proportion of seniors in a country that the world has never seen before. It is often discussed and debated in the local politics and media.
“The country shouldn’t attempt to compensate for its dwindling population with revitalized productivity. Economist Yumiko Murakami explored this idea in her notion of a “silver economy.” For her, there is limitless potential when the most advanced technologies are married to innovative ideas to address the new demands of an aging society. Not only will a growing elderly cohort demand new products and services, but it will also require the redesign of social infrastructure, which ranges from transportation to health to education. At the same time, labor shortages will allow Japan to adopt technological fixes to productivity problems without having to fight opposition from labor like other countries with younger populations. Like Kushida, she concluded that “potential markets for these types of innovative products and services are vast and commercially attractive. Japan is well-positioned to enjoy a first-mover advantage in this regard.”
Much of the rest of the world is slowly heading that way. In terms of largest economies, both Japan and US are wealthier countries. But China and India have not reached that threshold and yet will have a very big ageing population, although with better dependency rations. Still, how Japan addresses some of these areas will pave the path for rest of the ageing world as well.
7. Composition of GDP
For the economy of Japan, agriculture contributes 1% of the GDP, industrial ~29% and service sector, 70% to the GDP. This is similar to Germany in many ways. But if one looks at the US, agriculture contributes 5.6% and the services sector contributes ~75% to the GDP, while in China, the largest manufacturing economy in the world, the industrial sector accounts for 40.1% of the economy with agriculture also contributing 6.9%. Amongst the larger economies, perhaps it is only India with 17.4% contribution from agriculture, and yet, in terms of dollar value, China is the largest in terms of agricultural output ($843 billion against India’s $391 billion).
Japan contributes over $1 trillion to manufacturing. It has the third largest manufacturing output in the world after China’s $2 trillion, and US’s $1.8 trillion. Perhaps worth mentioning here that Japan has been either the second or third largest manufacturer globally since 1970s, with China coming up as a large manufacturer only in the last couple of decades. In the 1970s, Russia used to be one of the larger manufacturers. (Note – ‘Industry sector’ in GDP generally includes mining, manufacturing, energy production, and construction.)
For Japan, in the 1950s, agriculture contributed ~20% of the GDP, but by late eighties, this was close to 3%.
In terms of employment, 25% of the working population is in manufacturing, 72% in services and 3% in agriculture.
8. Exports and Imports
Japan is the fifth largest exporter and importer in the world.
In 2023, Japan imported ~$ 1 trillion worth of goods and services and exported around $920 billion worth of goods and services. Traditionally it has had a large trading surplus, but recently this seems to have shifted.
To compare, the world’s largest exporter is China with exports of $3.51 trillion and the world’s largest importer is United States with $3.81 trillion imported. United States is also the world’s second largest exporter.
For Japan, the largest import categories are energy related (crude, petrol, gas, coal – over $200 billion), integrated circuits ($28.9 billion), and broadcasting equipment ($20.3 billion). The largest export categories were cars ($89 billion), machinery having individual functions ($38.5 billion), integrated circuits ($36.9 billion) which as a category is also one of its largest imports. Also incidentally, automobiles are world’s largest traded goods ($1.35 trillion, with Germany being the largest exporter). Refined Petroleum is next at $825 billion.
“Japan is a country lacking natural resources, and hence has developed itself as a processing nation, importing raw material and exporting value added products.”
In 2022, Japan was the world’s biggest importer of other prepared meats ($3.02 billion – this is different from the main items of meat traded across the world), ethers ($2.28 billion) and processed tobacco ($1.75 billion). And it was the world’s biggest exporter of machinery with individual functions ($38.5 billion) and hot-rolled iron ($11.2 billion).
In terms of trading partners, the key countries where most goods exports go from Japan are United States ($137 billion), China ($135 billion), South Korea ($50.8 billion). Japan imports most from China ($178 billion), Australia ($80 billion), US ($80 billion).
Perhaps here, a bit on Japan’s investments around the world too.
Japan is one of the largest Foreign Direct Investor around the world. In 2023, it was the second largest with outgoing investments of $184 billion. Total global FDI was $1.55 trillion in 2023 (flow). US being the largest in the world with $404 trillion FDI investments. China, third largest with $148 trillion.
Japan’s position of holdings is sixth largest in the world, with holdings of over $2 trillion (stock). Most of these FDI holdings are in the US, followed by Netherlands and UK.
Total world outward FDI stock is $44.3 trillion (2023). Some of the largest holdings are with US ($9.4 trillion, although inward of $12.8 trillion), Netherlands ($3.3 trillion), China ($2.9 trillion, China inward is $3.6 trillion), Canada ($2.7 trillion), Germany ($2.1 trillion) and Japan with $2.1 trillion.
The interesting thing about Japan is inward FDI stock is only $225 billion compared to the inward FDI numbers of some of these other large economies. “The major investing countries in terms of FDI stock are the U.S. (22.3%), the UK (16.7%), Singapore (10.4%), the Netherlands (7.3%), France (7%), and Hong Kong (5.7% – data Japan External Trade Organization). Investments are mainly oriented towards finance and insurance, transportation equipment production, electric machinery, communication, and chemicals and pharmaceuticals.”
9. Agriculture
Agriculture in Japan contributes ~1% to national GDP. Most of Japan is mountainous, and only about 12% of the land in the country is appropriate for farming. In terms of agricultural food-sufficiency, although many countries in the world are self-sufficient and exporters, only a few developed countries are self-sufficient (such as Australia, US, France). Japan is around 38% self-sufficient on calorie basis and 58% on production value basis.
This makes Japan the second largest agricultural product importer in the world. (China is the largest importer). And even though it needs to import agriculture goods, Japan is self-sufficient in rice production. It is the 12th largest producer of rice in the world, largest being India and China (both order of magnitude higher than rest). Rice is the most important crop in Japan, and other crops include soybean, wheat, barley.
Over the recent years, wheat consumption has gone up in Japan with changing food habits.
“The United States is the largest supplier of food and agricultural products to Japan, with the largest share of imports, followed by the European Union, China, Australia, and Thailand. Japan is the largest export market for U.S. beef and pork, valued at nearly $5 billion combined, and the second largest market for U.S. corn, valued at $3.3 billion.
Japan’s largest grain import from the US is maize, with about 15 million tonnes of US maize imported in 2018.”
In terms of total agricultural output:
“The breakdown of the value of agricultural output by sector: Livestock led the way at ¥3.5 trillion (38.5%), followed by vegetables at ¥2.2 trillion (24.8%), rice at ¥1.4 trillion (15.5%), and fruit at ¥0.9 trillion (10.3%).”
Agriculture was one of the key employers until WWII (50% of workforce), but over the time since, with rapid industrialisation, now agriculture employs around 2 million people (or 3% of workforce). Perhaps a stark figure here is the decline in number of farmers over the decades (from 10 million in 1970 to 2.6 million in 2010), and the increasing proportion of farmers over 65 years of age (from 18% in 1970 to over 61% in 2010). Japan has the fastest-aging agricultural labor force. There has been a major change since WWII because of the competition of labour from industrial sector.
“Family farming still accounts for over 90% of total farming enterprises. But Japan’s farming population has been declining, accounting for just 1.1% (1.36 million) of the total population in 2020. While family farming remains a dominant form of agriculture in Japan, it is no longer the social foundation of the country.”
10. Farm sizes
One of the interesting indicators for Japan is that amongst the developed countries, it has one of the lowest average farm sizes. Where countries like US and Canada have average farm size of over 100 hectares, UK, ~71 hectares, France & Germany, somewhere between 40-45 hectares, Japan has an average farm size of 1.2 hectares.
Italy, another relatively developed country has average agriculture hectare size of 7.57.
India also relies on small farms, average being 1.33 hectares, but India has a large population relying on agriculture as primary source of work and revenue. Amongst developed countries, Japan presents a unique picture.
Perhaps the starkness of how two countries differ – for Japan, the number of farms has fallen from 2 million to 1.1 million, still it is not very different from US, the third largest global producer of agricultural products (after China and India). The US also has around 1.9 million farms. But the area under cultivation is degrees of magnitude higher since the average farm in the US is 187 hectares against Japan’s 1.2 hectares. (Some data sources now put it closer to 3 hectares).
Part of the reason is Farmland Reform after WWII where farmers were permitted to own farmland up to one hectare and were also prohibited from renting additional farmland resulting in many tiny holdings in Japan. Though such restrictions do not exist, still perhaps it has had a long term effect on the ways in which farmers value farmland.
“When labor is abundant relative to land in the early stage of economic development, labor-intensive methods of cultivation are socially efficient. In such cultivation systems, no major indivisible inputs are used and, hence, there is no major source of scale economies. Roughly speaking, a farm of 1–2 hectares can be managed efficiently by family labor consisting of a few workers. Beyond that scale, hired labor must be employed. However, the monitoring cost of hired labor arises, which increases more than proportionally with the cultivation size (Feder 1985; Otsuka, Chuma, and Hayami 1992; Hayami and Otsuka 1993). This explains why the family farm dominates in agriculture in most countries in the world (Berry and Cline 1979; Eastwood, Lipton, and Newell 2010). Thus, the optimum farm size in low-wage economies is bound to be small because of the limited availability of family labor and the costly substitution of capital for labor. This situation was predominant in East Asia (that is, Northeast and Southeast Asia), which justifies the dominance of relatively small operational sizes.
Now, even though the East Asian nations are moving towards higher average farm size, South Asia farm sizes continue to stay at similar small sizes as past. It is perhaps a reflection of primary dependence of a family on a farm, rather than farming as an enterprise. And perhaps it is a function of real wages in the economy:
“In South Asia, the land-labor ratio has not increased in the period from 1961 to 2014. In Pakistan, India, and Nepal, declines in the land-labor ratio were observed in recent years (India shows a downward trend). In contrast, machine use per worker has been increasing over time in all countries except Pakistan and Nepal in recent years. At the stage where machine use per worker increased while land-labor ratio staying relatively constant, as seen in South Asia and many Southeast Asian countries, the process is driven by small-scale machines that do not require large operational size. However, when real wages start rising fast, the need to introduce large-scale machines coupled with an effort to increase operational size (farm size) becomes much stronger.”
11. Income-Doubling Plan
Consider the following:
“After World War II, about 6 million people returned from overseas to devastated national land. Furthermore, due to a poor rice crop in 1945, food rations could not be distributed in large cities, and people suffered from starvation.The government initiated an emergency reclamation project in 1945 for an urgent implementation of food production increase and unemployment measures.
Japan recovered her sovereign power in 1951 with the conclusion of the San Francisco Peace Treaty.
In 1956, the government declared that the country “no longer be termed postwar” in economic white papers, and the basic policy of Japan was to become a big economic power with increased national incomes.”
Since the post-war years, Japan has set up many economic plans, over fifteen, but one of the most interesting things (compared to such other plans elsewhere) these plans ended up delivering much more than initially planned.
One such plan was Income-Doubling Plan. After the Self-Support plan of 1955 which aimed for restoring equilibrium in balance of payment situation and aimed for 5% growth rate and delivering all of the plan in two years against five, this Income-Doubling Plan plan adopted in 1960 shifted the drivers of the Japanese economy. The aim was to double the national income within ten years or realise 7-8% p.a. growth, through five major policy objectives:
“The five elements in the plan are (1) expanding social overhead capital, such as roads, harbors, factory sites, and water facilities, which tend to lag behind direct productive capital, (2) strengthening the industrial structure by increasing the relative importance of the sectors where labor is more productive, such as the heavy and chemical industries, as well as by raising the productivity of individual enterprises, (3) promoting foreign trade and international economic cooperation, (4) improving the quality of labor and promoting science and technology, and (5) improving the living standards of the low-income group and increasing over-all social welfare.”
Like other such economic plans drawn by Japan, it delivered more than planned. Japan’s annual growth averaged more than 10% during the period and the economy doubled in size in less than seven years. There was ambitious investing in urban infrastructure. During this period was the 1964 Tokyo Olympics and related infrastructure spends, Shinkansen (bullet train), Expressway and underground metro system. High quality Japanese products began to be exported across the world. Social safety nets were created.
The plan has been a case study for many developing countries.
12. Government Debt
In proportion to its GDP, Japan has the highest outstanding Government debt amongst all the large economies of the world (~250% of GDP). Amongst all other countries too, perhaps the only country with higher proportionate debt is Sudan and at some point, Lebanon.
The total gross government debt as of April 2023 was $9.4 trillion. It touched a high of $12.6 trillion in 2012. In terms of actual absolute numbers, perhaps USA has the largest national debt ($32 trillion in 2023, at 120% of the country’s GDP). USA also makes up a third of the global government debt outstanding. Perhaps the larger developed economies in the world face this problem of high debts with low growth rates further resulting in higher debts due to deficit funding. 68% of the global debt is held by developed countries. (Which is a strange long term unsustainable path development has taken).
China also has a high climbing gross debt, at $14.6 trillion. Still in terms of percentage of its GDP, it is at 83.6%.
Anyhow, the numbers in Japan are highest in proportion of its economy. The reasons lie in the ‘lost decades’ since the asset price bubble collapse in 1991. Before this (and after the temporary highs of world war period, Japan’s debt outstanding in 1989 was at ~70%).
“Japan’s asset price bubble collapse in 1991 led to a prolonged period of economic stagnation described as the ‘Lost Decades’, with GDP falling significantly in real terms through the 1990s. In response, the Bank of Japan set out in the early 2000s to encourage economic growth through the non-traditional policy of quantitative easing. By 2013, Japanese public debt exceeded one quadrillion yen (US$10.46 trillion), which was about twice the country’s annual gross domestic product at that time, and already the largest debt ratio of any nation.
Until the 1980s, the gap between tax revenues and expenditures was relatively small, so that the amount of JGBs issued for each fiscal year never exceeded ¥15 trillion. However, with the collapse of the bubble economy and prolonged economic stagnation, the balance of payments deteriorated as a result of repeated fiscal stimulus packages and tax cut policies. The outstanding amount of issued government bonds has since been increasingly annually and is predicted to reach ¥1.1 quadrillion by the end of fiscal 2024.”
..
“During the Japanese asset price bubble of the late 1980s, revenues were high due to prosperous conditions, Japanese stocks profited, and the amount of national bonds issued was modest. With the breakdown of the economic bubble came a decrease in annual revenue. As a result, the amount of national bonds issued increased quickly. Most of the national bonds had a fixed interest rate, so the debt to GDP ratio increased as a consequence of the decrease in nominal GDP growth due to deflation.”
..
“The growth of annual revenue was slowed down by the prolonged depression. Consequently, the governments started issuing additional national bonds to cover the interest payments. This national bond is called renewal national bond. As a result of issuing these bonds, the debt is not actually repaid, and the amount of bonds issued continued to grow. Japan has continued to issue bonds to cover the debt since the asset price bubble collapse.”
On average 40 trillion yen of bonds issued every year for last 25 years. (Which is c. $300-400 billion depending on exchange calculations)
13. Savings & Wealth
After WWII, Japan had one of the highest household saving rates in the world. It showed an upward trend until mid-1970s when it peaked at 23.2% and since has been showing a downward trend – by 2004, it was 2.6% and by 2022, around 3.4% (except during Covid period). The decline is often attributed to the decline in savings of elderly households.
“However, it is likely that other factors such as the unavailability of consumer credit, the unavailability of social safety nets, high rates of economic (income) growth, tax breaks for saving, saving promotion policies, and high and rising land and housing prices are also partial explanations for why Japan’s aggregate household saving rate was so high during the 1961-86 period and why it declined so much subsequently.”
This high household saving rate is credited for being one of the primary causes of Japan’s double-digit economic growth during the 1950s, 1960s, and early 1970s (the so-called “Japanese economic miracle”).
According to one data source, the total wealth in the world is estimated at $454 trillion. In terms of the large countries, $139.9 trillion of this wealth is in US, $84.5 trillion in China, and Japan is perhaps the third largest at $22.6 trillion.
In terms of asset mix in Japan, although similar to other developed countries, a large part is financial assets (63.2%, similar to North America’s 62.8%, although different from Aus/NZ’s 40% and Europe’s 50%, remaining being real estate). “This is surprising as real estate assets – usually the owner-occupied house – are generally regarded as the largest asset item on a household‘s balance sheet.”
Still, in terms of financial assets, what stands out for Japan is that relatively few people own stocks (over the last ten years, equities have gone up from ~10% of household assets to ~14.2% of household assets, compared to ~40.5% of US household assets). Many keep their savings in bank accounts. This is a very different picture compared to the rest of the developed world, many developed world households withdrew deposits from banks to the exception of Japanese households (and South Korean and German).
“As of March 2024, currency and deposits accounted for the largest share of financial assets held by households in Japan with 50.9%. Currency and deposits were followed by insurance, pension, and standardized guarantees with about 24.6%. Household financial assets in Japan amounted to over two quadrillion Japanese yen in 2024.”
..
“Savings behavior is a decisive factor for asset growth. There are basically two sources of growth in financial assets: savings efforts and price increases (increase in value). For example, over the last 20 years, increases in the value of portfolios in the US – with its strong savings bias towards capital markets – have contributed an average of 62.4% to annual growth; in Western Europe, this figure is 34.2% (in Germany, growth over the long term is driven almost exclusively by savings efforts). This significant difference certainly contributes to the Atlantic divide in long-term growth in financial assets: While financial assets in Western Europe have doubled in the last two decades (+104%), the increase in the US is a whopping +178%, also bolstered by more favorable market developments.”
In terms of time trends, North America (for the last 20 years) has held around half of global financial assets. During the last two decades, China’s share of global financial assets grew from 2.6% to 14.1%, Japan’s share came down in relative terms.
“Over the course of this century, and particularly after the 2008 global financial crisis, financial wealth has grown at a faster rate than non-financial wealth.”
In terms of what form this wealth or global assets take, $380 trillion is real estate ($287 trillion residential, $51 trillion commercial and $41 trillion agricultural land), $130 trillion in debt securities, $99 trillion in equities and total gold ever mined of ~$12.2 trillion. For context, the global GDP is ~$100 trillion.
Of the total global real estate, China accounts for a quarter of the global real estate value ($88 trillion), followed by the US at 19% , and Japan next at $20 trillion. (To note that to compare wealth numbers with asset numbers, one has to adjust for financial liabilities as well).
There are several ways to consider global wealth. Another way to consider it is as done by McKinsey. This is contrasting to the usual way of looking at household assets and liabilities. Here, by drawing a global balance sheet, one looks at the real net worth of the globe, the ‘real’ assets, cancelling out for all financial ownings and owed.
“At a functional level, the global balance sheet has three components that interlock: the real economy balance sheet, the financial balance sheet, and the financial sector balance sheet. Each amounts to about $500 trillion, or the equivalent of about six times GDP.”
With their estimates (before cancelling out for liabilities), world’s total assets are $1,540 trillion. Around two-thirds of these are financial assets, which with around $1,000 trillion of financial liabilities are netted off. So the net-worth remaining is $500 trillion. (Similar to the other number on global wealth). Real Estate accounts for a third of the real assets.
“The real economy balance sheet has $520 trillion in real assets, such as machinery and equipment, infrastructure, buildings, natural resources, and intellectual property, or IP. These are mirrored on the liability side as net worth.”
Perhaps what is interesting in their way of seeing is that as a ratio of GDP, each of these components grew from about $150 trillion in 2000, or about 4 times GDP to about $500 trillion or about 6 times GDP in 2020.
“Before 2000, net worth growth largely tracked GDP growth at the global level, with occasional country divergences from the pattern, such as in the United States in the late 1970s and early 1980s in the run-up to the savings-and-loan crisis and in Japan during the asset bubble followed by a banking crisis in the early 1990s. Nearly all net worth growth from 2000 to 2020 occurred in the household sector as a result of growing equity and real estate valuations.”
Especially in advanced economies, the cause of this divergence of the link from GDP:
“In an economy increasingly propelled by intangible assets like software and other intellectual property, a glut of savings has struggled to find investments offering sufficient economic returns and lasting value to investors. These savings have found their way instead into real estate, which in 2020 accounted for two-thirds of net worth. Other fixed assets that can drive economic growth made up only about 20 percent the total. Moreover, asset values are now nearly 50 percent higher than the long-run average relative to income.”
The question it raises: “is it healthy for the economy that high house prices rather than investment in productive assets are the engine of growth, and that wealth is mostly built from price increases on existing wealth?”
(Perhaps here worth mentioning, that a large portion of this ‘wealth’ is consolidated with the top few. These numbers are just to place things in context – esp the picture of overall distribution across countries. The wealth numbers mean little in a lopsided world. (Half the world has less than $10k to their name). Here again, this is the enumerated world only. It is a very rough indicator esp given PPP differences. Only between the top few advanced economies is there some semblance of comparison. One of the things that has happened since 2000 is the general global expansion of middle classes. There is a lot of growth, but there is a lot yet to be done in terms of a minimum standard of living for a lot of people across the world.)
On that note, again, in advanced economies, Japan stands out.
Piketty’s main assertion is that the leading driver of increased inequality in the developed world is the accumulation of wealth by those who are already wealthy, driven by a rate of return on capital that consistently exceeds the rate of GDP growth. Japan, however, has lower levels of inequality than almost every other developed country. Indeed, though it has long been an industrial powerhouse, Japan is frequently called the world’s most successful communist country. Japan has a high income-tax rate for the rich (45%), and the inheritance tax rate recently was raised to 55%. This makes it difficult to accumulate capital over generations – a trend that Piketty cites as a significant driver of inequality. (From 2015)
In terms of inheritance tax around the world, Japan has the highest at 55%. In the US and UK, this is 40%, South Korea, 50% and France 45%. Many other developed countries do not have any or they have eliminated it as there is much debate on the net benefits of taxing inheritance. Even countries like Norway and Sweden, otherwise known for their less capitalistic policies.
14. Pension Funds
Government Pension Fund Japan is the largest pension fund in the world with total assets of $1.6 trillion. It has ranked top in the world since 2002. To put it in context, the top 300 pension funds in the world total $22.6 trillion, and the total pension assets across 22 major pension markets account to $55.7 trillion.
There are 11 other pension funds from Japan in the top 300 pension funds globally, 4 of them with over $100 billion in assets.
Although the world’s largest pension fund is from Japan, in terms of total pension assets held by a country, US is by far the largest with $35.6 trillion, followed by Japan with a total of $3.3 trillion, UK $3.2 trillion. Twenty years ago, these numbers were $10 trillion for US and $2.9 trillion for Japan, $1.2 trillion for UK. The growth in pension asset base is different in other countries.
Pension Funds can be Soverign Funds (like the Japan GPIF, there are 24 in top 300, managing 30% of total AUM), Public Sector Funds (generally for public sector workers, 128 in top 300, 40% of total AUM), Private Independent Funds (managing pension plans for different employers, 68 in top 300, 16% of total AUM) or Corporate Funds (80 in top 300, $2.9 trillion or 13% of total AUM). In terms of ratio to GDP or relative to the size of economy, Japan’s public pension reserve fund (PAYG schemes) is one of the highest in the world (38% of GDP, only South Korea has higher at 46% of GDP). The US has a larger public pension reserve fund in dollar terms ($2.6 trillion in reserves, 9.7% of GDP), but as a proportion of its total pension assets, it is relatively insignificant.
Currently most of the pension assets in Japan are held in bonds (56%), 25% in equity. Compared to this, the investment strategy in the US is 46% equity, 34% bonds. And though for US these equities are mostly domestic (~70%), for Japan, only ~30% are invested in domestic stocks.
And still, Government Pension Fund Japan was until recently the largest investor in the equity markets in Japan. (At the moment, Bank of Japan is the largest equity investor in Japan with $470 billion in Japanese equity or ¬8% of total Japanese Stock Market) (personally, I consider this a point to further explore and assess – this relationship of institutional money with equity – the liquidity and consolidation of world markets, the connectivity). “It is unusual for the central bank to pour more money into the stock market than the national pension fund.”
In terms of the kind of plans, Japan has primarily Defined-Benefit (DB) plan (95%) against, say the Defined-Contribution (DC) market (88%) of Australia, another large pension asset country ($2.4 trillion) esp relative to its GDP. The US is also ~67% DC market. Canada is 43% DC. UK (81%) and Netherlands(95%) are DB markets similar to Japan.
“As the names imply, a defined-benefit plan—also commonly known as a traditional pension plan—provides a specified payment amount in retirement. A defined-contribution plan allows employees to contribute and invest in funds and other securities over time to save for retirement. These key differences determine which party—the employer or employee—bears the investment risks and affect the cost of administration for each plan.”
Globally, the long-term trend has been a shift away from defined-benefit plans given the higher inherent risks for employers (they need to cover for any funding shortfall to meet the defined benefits), and the move to DC makes the contributions more predictable. Hence, in countries where the pension is largely public, private or corporate, there is a slow move to defined-benefit plans.
At the moment, DB funds account for ~60% of the disclosed AUM of global top 300 pension funds.
15. Market Capitalization
The market capitalization of the Tokyo Stock Exchange (TSE) in Japan as of Dec 2024 was $6.475 trillion. The Tokyo Stock Exchange is one of the largest in Asia in terms of volume. It is managed by JPX (Japanese Exchange Group). The TSE has three market segments: the Prime Market (bulk of the market cap, $6.24 trillion, across 1640 companies), the Standard Market, and the Growth Market.
Founded in 1878, TSE is the 4th largest exchange in the world. The top two American exchanges are significantly larger than rest of the world. NYSE ~$30 trillion market cap, NASDAQ $28 trillion, followed by Shanghai Stock Exchange $7.2 trillion, JSE is fourth largest at the moment with $6.2 trillion.
And yet, just to put things in context, here is a little snippet of its history: “In early 1989, by market cap, Japan accounted for 45% of the global stock market, followed by the U.S. at 33% and the U.K. at 9%.” As the author there puts it, it is an incredible shift of global fortunes in 30-35 years.
3,800 companies are traded on the exchange currently. (This number was 1389 in 1978) . The largest company traded on the exchange is Toyota with $232 billion market cap and revenue of $312 billion. It is 45th largest company in the world by market cap. By comparison, Apple, the largest company in the world by market cap has $3.56 trillion market cap, and revenue of $391 billion. Walmart is the world’s largest company by revenue of $665 billion.
Other top few companies are Mitsubishi UFJ Financial ($141 billion market cap), Sony ($132.41 billion market cap), Hitachi ($118 billion). Perhaps to note here that there are 44 companies on TSE which grew over 10x in 10 years to 2022. The largest growth was in Sony which grew 12.4x during this period.
Before the asset bubble burst of 1991:
“In 1989, of the world’s top 50 companies by market capitalization, 32 were Japanese; by 2018, only one such company (Toyota) remains in the top 50.”
The Tokyo Stock Exchange’s benchmark index is the Nikkei 225. It fell significantly during the lost decades, but a few years ago, it climbed back to 1991 levels, and as of March 2024, reached a 34 year high of 40,000.
While we were travelling in Japan, Yomiuri Shimbun (the largest newspaper in the world by circulation), announced a new stock index in November 2024. It will be called Yomiuri 333 and will have 333 constituent companies. It will be launched in March 2025. It plans to equally weigh each stock in calculating the value unlike some of the other indices which are capitalization weighted (Tokyo Stock Exchange owned Topix and 198 constituent MSCI Japan Index) or price-weighted Nikkei 225 (launched by the world’s largest financial newspaper – The Nihon Keizai Shimbun or Nikkei. Other Price-weighted examples are Dow Jones Industrial Average.
The other new development which signifies Japan’s keenneess to open itself to foreign investment, is the requirement for English reporting from April 2025:
“To attract more foreign investment, all companies listed in the Tokyo Stock Exchange’s Prime market — 1,600 of them in total — will need to release quarterly financial statements and other key information simultaneously in English and Japanese from April.”
At the moment, only 8% of Prime market companies provide full English-language versions.
16. Banking Sector in Japan
Japan banking sector has an asset base of $17 trillion. There are around 200 banks in Japan, with five major city banks. The Bank of Japan is the banker of last resort in Japan and controls the money supply.
There are large number of banks in Japan – five large city banks and over 100 regional banks.
The largest bank in Japan is Misubishi UFJ (or MUFJ), with total assets of $2.9 trillion. It is the 9th largest bank in the world. (Largest is ICBC China with $6.3 trillion in assets). Top 4 are banks from China. The second largest Japanese bank is Sumitomo Mitsui Financial Group with total assets of $2 trillion. It is 13th largest in the world. Mizhuo, third largest in Japan is 17th largest in the world, with $1.9 billion total assets. The largest US bank JP Morgan Chase is fifth largest in the world with $3.8 trillion total assets.
Like some other countries in the world, the postal system in Japan also operates a banking system. With its reach of 24k branches, it is fourth largest financial institution in Japan with $1.7 trillion in assets. The US had a postal banking system from 1911 to 1967. In China, France and Japan, postal systems are full service banks. The total number of bank branches in Japan is 13.6k and Japan post has around 24k branches. For a large part of its history, Japan Post was government owned, but in 2005, a privatisation program for Japan Post began, and now government holds less than 50%.
In Japan, banking system has consolidated dramatically since 1990s. Some of these M&A figure in the largest M&As in the world. For instance, in 1989, Mitsui Bank acquired Taiyo Kobe Bank for $22.8 billion, in the second largest M&A of eighties. In 1999, Sumitomo Bank acquires Sakura bank for $45.5 billion in the fifteenth largest M&A of 1990s. In the same year, Fuji Bank acquired Dai-Ichi Kangyo Bank and Industrial Bank of Japan for $40.1 billion. In 1995, Mitsubishi Bank acquired The Bank of Tokyo for $33.8 billion.
“For almost two decades, Japanese banks have operated in an ultralow interest rate environment and struggled with low profitability, forcing them to cut cost and seek business opportunities in overseas markets. Regional banks, of which there are over 100, have been particularly affected by Japan’s demographic change and declining economic activity in rural areas.”
Perhaps here a little note about mortgages in Japan. Since mid-nineties, Japan has had near-zero interest rates. Earlier in 2024, Bank of Japan raised the interest rates for the first time in almost two decades, from -0.1% to a range of 0 to 0.1%. (For context, before the bubble burst, the Japanese interest rates were around 6% in 1990. Since then, rapid decline until mid nineties, and for the last couple of decades, it has been in the very close to 0 range, when not negative). This prolonged period of Japanese low/negative interest rates resulted in a rippling effect in the world as well leading to large holdings in yen carry trade, with investors borrowing in Japan yen to take advantage of the low interest rates.
The total amount of outstanding housing loans to households in Japan was $987 billion in early 2024. This was 24.6% of the GDP. In the US, this number is ~$20.7 trillion.
17. A snapshot of IPOs, VC and PE in Japan
Japan has a relatively accessible IPO (Initial Public Offering) market with many small companies going in for listing early. Still, given the language barriers, most listings are local unlike some other developed country markets.
“The global IPO market recorded 1,215 deals, raking in US$121.2b in proceeds for 2024, falling slightly behind 2023 levels.”
~60% of this was accounted by US markets. The total was lower than 2023 given much slower IPO markets in China and HK.
Japan recorded $6.2 billion in capital raise in 2024 from ~84 IPOs. (In 2023, this was ~$3.7 billion). The largest IPO in 2024 was that of Tokyo Metro in October, which raised $2.3 billion. Tokyo Metro, which carries ~6.5 million passengers daily on average is one Tokyo’s two major subway operators. X-Ray technology company Rigaku closed a $863 million IPO. This was a Private Equity (PE) exit with Carlyle exiting the company. In December, Japanese chip maker Kioxia Holdings listed on Tokyo Stock Exchange, third largest for the year with $800 million. This was also PE exit, where Bain Capital exited part of the shareholding.
IPOs serve as fundraising means as well as an exit route for Venture Capital (VC) and Private Equity to list and exit shareholding in their portfolio. Compared to the US, where the ratio of IPO to M&A exit for VC backed companies is 3:7, it is 8:2 in Japan.
In 2024, public listings of private equity- (PE) and venture capital- (VC) backed portfolio companies generated 46% of total global IPO proceeds, highlighting their substantial contribution to global IPO activity and reinforcing the critical role of PE and VC firms in shaping the IPO landscape. Out of the 20 mega IPOs in 2024, 12 were PE-backed, a significant increase from the two listed last year. There were also 18 unicorn IPOs listed in 2024, half of which were launched by VC firms, up from just three in 2023.
VC in Japan is growing over the last decade. From very little amounts a decade ago, to now, $7 billion was invested in Venture Capital in Japan in 2023. As a comparison, total startup funding in the US was $160 billion in 2023. A large area for VC investments is AI. The other aspect about Japan VC scene is the significant presence of Corporate Venture Capital. Also Japanese VC investments are heavily weighted towards Seed Stage.
Another indicator that people track is the number of unicorns in a market. That is fairly limited in Japan: at the moment 7 to 9 comapred to ~660 in the US.
In terms of Private Equity in Japan, the aggregate deal value was $50.8 billion in 2023. (Total global deal volume was $474 billion in 2023). It is now becoming one of the larger markets in Asia Pacific. In 2023, Japan saw its largest PE transaction when Toshiba was taken private by Japanese Industrial Partners for $14 billion. The PE market in Japan has begun to rise recently from 2017. 8% of M&A was PE on average from 2014-2020 compared to 15% in US. Additionally, given the stage of the market, the kind of deals that dominate the market are buyouts.
One number that I came across which is quite interesting is the average EBITDA margin of Japanese companies (2018-20), it was 9.4% on TSE listed companies, compared to 15.1% on NYSE signalling the opportunity of margin improvement. Also “The average EBITDA multiple of the Nikkei 225 Index is 9.5x vs 16.4x for the S&P 500” which attracts PE investors to the region. The other factor is: “The average age of CEOs in Japan is 64 years old – and approximately 1.5 million family-owned companies have not identified a successor.”
18. Fishing in Japan
“Due to Japan’s geographical features and proximity to desirable currents, fisheries traditionally play an important role in food security and are as old as Japanese culture itself.
The country’s coastline stretches over almost 30,000 kms, and no Japanese territory is further than 120 kms from the sea. Because of the cold ocean current Oyashio from the north colliding with the warm ocean current Kuroshio of the Pacific Ocean, the waters surrounding the archipelago are among the world’s most productive and varied fishing grounds.”
Once the world’s largest fishing nation when it reached its peak production in 1984 producing 12.8 million tonnes, fishing in Japan is changing over time. The output declined to 4.8 million tonnes in 2012, and at the moment, stands closer to 4 million tonnes.
Japan’s fishing self-sufficiency has been declining. From being an exporter until 1970s, sometime in the last two decades, Japan became the world’s largest importer of fish and fish products. And then since, changing food habits throughout the world and changing demographics, Japan is now the third largest importer of aquatic produce ($15 billion).
“Japan was the world’s largest fishing nation from the 1930s through the 1980s, is historically among the globe’s most voracious consumers of seafood, and has long been a central player in the international marine products trade, both as a leading exporter and as a major importer.”
Exclusive Economic Zone (EEZ) came in 1982, and although Japan has a large EEZ, which is an area of the sea which a sovereign state has exclusive rights regarding exploration and use of marine resources, of 4.4 million km squares, which is eighth largest in the world (largest EEZ being France’s 11.6 million km sq, US with 11.3 million km sq), it reduced access to international waters for Japan and led to overfishing.
“Until the early 1970s, Japan was a net supplier of fish and seafood products, but when the 200 nautical mile EEZ was implemented it changed Japan from a net-exporter to a net-importer.”
Over time, the number of fishing vessels owned in Japan has gone down (from 416,000 registered boats in 1990 to 132,000 in 2018). The per capita consumption of seafood in Japan dropped from 66 kgs in 2000 to ~41 kgs per capita in 2021 (some explained by rising meat consumption). Although this shows a trend different from the rest of the world where fish consumption is going up, especially in China (which is now at same level as Japan), Indonesia (which is now more than Japan), and the US (now at 22kg).
Like agriculture, fishing in Japan is also seeing severe labour shortages (number of people working in fishing dropped by 53% in a quarter of century) – primary factors being ageing and emptying out of fishing villages. At the moment, ~123,000 people work in fishing (down from 238k in 2003). To counter these effects, the fishing sector is relying more on foreign labour. It is estimated that the government provides ~$1.3 billion of support to fishing.
Over time, aquaculture has changed the way fish is supplied. Although historic, it changed over the last two decades, with 2014 marking the year when aquaculture globally overtook captured fish. Until 1980, it was 7% of total fishing output. China being the main place where it has changed). Japan has ~900k tonnes from aquaculture against ~3.1 million tonnes from direct fishing. China farms 73 million tonnes from aquaculture and 13.4 million from direct fishing. Like for many other industries in the world, China has changed the face of fishing over the last 3-4 decades.
“China is the world’s dominant fishing power. By several measures, the scale and reach of its fishing economy surpasses that of any other nation. In marine capture fisheries, it produces 15% of world catch, nearly twice the catch of the next largest fishing nation, Peru. Its fleets are distributed across China’s four regional near seas, in distant waters under the jurisdiction of other countries, and on the high seas. In marine and freshwater aquaculture, China produces more farmed aquatic food than the rest of the world combined. Its marine fishing labor force includes over one million workers on 200,000 fishing vessels, while the broader fishing and aquaculture industry employs nearly 15 million workers. China is now the largest exporter and third largest importer of fish and fish products. However, China’s centrality in seafood trade is a relatively recent phenomenon and reflects a complementary combination of natural economic advantage and government industrial policy.”
Perhaps, here a little note on whaling as well since whaling has been important to Japan:
“In the 1960s, the whaling and fishing industries were holders of substantial power in the country. In the beginning of the 1960s the Japanese whale meat consumption was at its peak, being eaten more than any other meat. In the middle of the decade however it became more evident how scarce were resources becoming and a ban on some whale species was introduced. By the 1970s environmental concern over hunting whale practices was manifested by international organisations and overall negative sentiment over whaling was shared in the West. In 1975 the price of chicken meat was for the first time cheaper than whale meat. However, the amount of whale meat consumed remained constant. In 1986, a moratorium on commercial whaling for five years was adopted, mainly promoted by the United States. The Japanese negotiators had to agree to this as the American officials threatened to terminate the Japanese fishing quota in the Exclusive Economic Zone of the US. The fish caught in those waters were more valuable than the exclusive whaling mandate. After this, Japanese commercial whaling had to stop, but the government was unwilling to terminate the practice altogether, so they continued hunting allegedly for science.
Although commercial whaling in Japan ended in 1987, it still catches whales. In 2000, the Japanese whale catch of over 16,700 represented about 82% of the world’s whale catch. Japan is one of three countries – along with Norway and Iceland – that continues to hunt whales, and officials argue that the industry is an important part of its culture and history – and also provides food security.”
19. Bullet Trains
First built in 1964 for the Tokyo Olympics, in 2024, bullet trains (Shinkansen) were celebrating their 60 years.
“From 1964, when the first bullet trains made their inaugural journey: “Hundreds of people had waited overnight in each terminal to witness this historic event, which, like the Olympics, heralded not just Japan’s recovery from the destruction of the second world war, but the beginning of what would be Japan’s stratospheric rise as an economic superpower. The journey between Japan’s two biggest cities by train had previously taken close to seven hours. The Shinkansen had made the trip in four.””
With speeds now reaching 320 km/hr, the Japan bullet train/ Shinkansen covers 3,000kms. (The total rail network in Japan is close to 30,000 kms).
It is interesting that rail transport in Japan is not used as much for freight transport (<1% per one data source, and 6.2% modal share). It is primarily used for high-speed travel between cities by passengers and for commuter transport in cities. “The average Swiss person travels 2,430 km by train each year (the highest in the world), almost 500 more than the average Japanese person (the second highest).”
Although rail usage across the world is differently organised – US being the largest network in the world (149,000 kms, of which only 735 kms is high speed) but primarily for freight with relatively negligible passenger transport. China is becoming the world’s largest high-speed transport network (total rail network of 110,000 kms, high speed network of 40,500 kms with plans to reach 70,000 kms by 2035). Spain is the second largest high-speed rail network with over 3,600 kms.
Perhaps given the network and efficiency of its rail network, the modal share of railway transport (not including metro network) is the highest in Japan at 33%. China, with its spread, and the world’s biggest network of high speed passenger trains is at 32%. In the US, it is only 0.3%.
Carrying 420,000 passengers on a typical weekday, Bullet trains/Shinkansen carried 356 million passengers in Fiscal 2023. For comparison, in 2023, Japan airports handled around 284 million passengers. (And global air travel passengers are c. 5 billion)
“While China does operate some of the fastest trains worldwide, including the CRRC Qingdao Sifang 2021 Maglev, the title of fastest train worldwide is taken by Japan. Japan’s L0 Series Maglev can reach speeds up to 603 kilometers per hour, marginally faster than China’s fastest Maglev, which can go up to 600 kilometers per hour.”
Here, perhaps a quick note on the Subway networks in Japan as well.
“Public transport within Greater Tokyo is dominated by the world’s most extensive urban rail network. Tokyo’s rail system carries around 40 million passengers daily. This includes the subway, monorail, and other commuter rail systems.”
But Tokyo Metro (which is a small section of the larger Tokyo rail rapid transit system) has ~6.84 million daily commuters. It used to be one of the world’s busiest networks, but now Shanghai and a few other metro systems in China are busier. Shanghai hit a daily ridership record of 13 million in 2024. Add to it the Toei subway lines which brings in 3 million more daily commuters. These subways make up a relatively small fraction of heavy rail rapid transit in Tokyo alone—only 286 out of 938 railway stations. And the world’s busiest station – Shinjuku station is based in Tokyo. It sees over 3.5 million visitors daily.
20. Power generation in Japan
In terms of natural resources, Japan has negligible mineral resources and virtually no natural energy resources, making it almost completely dependent on imported energy sources. Amongst the larger economies of the world, perhaps Japan is one with very limited natural resources.
Japan is the fifth largest country worldwide in terms of electricity generation (>1,000 terra watt hours). For comparison China generates 9,456 terra watt hours, US 4,494 terra watt hours and third largest India, close to 2 pettawatt hours.
Globally, coal remains the world’s single largest electricity generation source contributing to 34% of global electricity. (10 out of 29.5 petta watt hours of global electricity production), followed by gas (22% – 6.6 PWH). Coal, gas and oil contribute 61% to global electricity, nuclear 8.8% (2.6 PWH) and rest by renewables (~30%).
In Japan, 69% of electricity is generated from fossil fuels which are imported. The electricity generated by coal in Japan (274 TWH) is fourth largest in the world (~29% of total electricity in Japan). Amongst renewable sources, Japan has solar power contributing to ~10.8% of electricity generation.
“Resource-poor Japan is dependent on imports for 94% of its primary energy supply. Japan’s energy supply structure is extremely vulnerable. Following the two oil crises in the 1970s, Japan has diversified its energy sources through increased use of nuclear energy, natural gas and coal, as well as the promotion of energy efficiency and conservation.
The “Strategic Energy Plan” decided by the government in April 2014 also states that nuclear power is as important base load power source that can, strictly premised on safety, contribute to the stability of the supply and demand structure of energy.
In June 2015, a plan was announced to maintain the proportion of nuclear power at 20 to 22% in the energy mix in 2030.”
At its peak, nuclear power contributed c.26% to electricity in Japan (2009 numbers). Nuclear power used to be a national strategic priority but things changed following 2011 Fukushima. Currently nuclear power is at 7.6% in Japan.
Globally, the largest nuclear power production happens in US (772 TWH, 18.6% of its electricity generation), China (395 TWH, ~5%) and France (282 TWH, 70 % of its electricity generation). As an aside, currently the world has ~440 commercial nuclear reactors, 220 research reactors and over 160 ships (mostly submarines) propelled by ~200 nuclear reactors.
The percentage of renewable energy power in Japan was 19% in FY 2020. Japan ranks sixth in the world in terms of renewable energy generation capacity, and third in the world for solar power generation. Japan is also leading the way in technological development and dissemination of power storage systems in its efforts to expand the use of fuel cells and Ene-Farms with 2.4 GWh installations of home power storage systems – the highest in any major market.
It is an intermediate step to eventually shifting to a primarily renewable power generation set.
For the 2030 electricity generation, the goal in Japan is for renewables to contribute 330-350 billion KWH contributing 36-38% from current 20%.
(Perhaps something to consider here is the changing wealth of nations, the relative significance of natural resources, agriculture (important for national security), in terms of wealth, the urban infrastructure (and related real estate values), the economy and capital markets (and relative equity values), the industrialisation and services (financial sector and value created in services and high value industries) – public & private investment driven value creation in most of the developed world.)
21. Steel Industry in Japan
Japan was the world’s largest producer of steel in early 1990s taking over from the previous leader USSR. Since 1995 though, changes in China as they changed the structure of many industries in the world, changed the steel industry significantly as well. At its peak, Japan was producing ~110 million MT of steel. Currently, Japan is the third largest producer of steel in the world at ~87 million MT. China, from almost half of Japan’s production in 1990, went on to grow significantly, and consistently fuelled its infrastructure demand with steel production of now reaching 1,000 million MT per annum. This implies the global production of steel has gone up from ~500 million MT in 1960s to 850 million MT in 2000, and since then with China adding hundreds of million MT every year, to 1.4 billion MT in 2010, and around ~1.9 billion MT at the moment (!). Pretty much the growth is driven by China demand.
Although it seems to now slow down, and for the first time in a few years, China demand has fallen below 50% of global demand.
The market size of the Japanese steel industry is $83 billion. The global steel market in dollar terms is $1.5 trillion.
Although Japan is the world’s third largest steel exporter, for raw material, iron and coal, it still relies on imports.
The key players in the Japan steel market are Nippon Steel (largest in Japan, fourth largest in the world, capacity of 44 million MT) and JFE Steel Corporation (25 million MT capacity). Nippon Steel has been working for a year to acquire US Steel which could make it the world’s third largest steel player, but US is expected to block the deal.
As an aside, the steel sword-making techniques came to Japan through China and Korea in c. sixth century, but were perfected over many iterations making Japanese swords some of the finest in the world combining high strength with high flexibility, a blend of technology and art. The steel-sword making was ritualised to reflect the right amount of carbon and iron proportions.
“It has been said that the samurai’s sword was his soul. Perhaps this deep attachment had something to do with the perfect melding of form and function found in the katana, as the famous curved sword is known in Japan. Invented a millennium ago, the katana remains a marvel of aesthetic beauty and skillful engineering. While most bladed weapons over the centuries were designed to either pierce or slash, the katana’s two different types of steel gave it optimum qualities for both, making it a highly versatile weapon in battle.”
22. Automobile Industry in Japan
The Japanese automobile sector is a key pillar to the country’s economy. At over $400 billion, it is the third largest auto sector in the world employing about 5.6 million people or 8% of the working population in Japan (of these 5.6 million people, road transport employed 2.79 million people). There are 78 factories in Japan. Automotive shipments (both domestic and exports) account for 17.4% of total Japan manufacturing. Investments in this sector translates to 20-30% of overall investment in Japan’s manufacturing sector.
In terms of context for Japan’s Automobile industry – the first car was brought to Japan in 1898, after the first automobile was invented in Germany in 1880s. The WWII focus was mainly on trucks and motorcycles for army, and in 1950s, Japan’s annual vehicle production was merely 10,000, but the key change came in 1960s, with the launch of Japanese Kei cars (light vehicles), making it affordable for more people to own cars. This boosted sales which in turn boosted the industry. In 1960s, the export spurt came with ~20% of cars being exported. 1960s was also the time when the “era of technological tie-ups” came to an end in Japan, with focus shifting to complete domestic production.
“Japan ranked sixth in 1962, surpassing Italy the following year to take fifth place; surpassing France in 1964 to take fourth place; surpassing the United Kingdom in 1966 to take third place; and surpassing West Germany in 1967 to rank second in the world after the United States, whose production Japan would also surpass in 1980 to become the world’s largest producer of automobiles.
Despite this tremendous rise in output, Japanese automobile production differed from that of other countries in terms of the type of automobiles produced (a high percentage of cars with small engine displacement), production infrastructure (multiple-model, small-lot production and small factory size), and the fact that there continued to be mixed, non-stop production of cars and trucks. Even Japanese used cars were also been used frequently.”
For around fifteen years, late 1970s to early 1990s, Japan was the world’s leading producer of cars/light vehicles (from 5.3 million in 1970s to a peak of 13.5 million units in 1990), surpassing US, the previous leader (in 1950, US produced ~75% of global light motor vehicles). Things changed from 1995 onwards, with US taking the lead again. For Japanese companies, offshore plants began to appear from 1985 onwards. And in this millenium, things have shifted again with China now surpassing both US and Japan. China manufactures about a third (30 million) of global automobiles (Light vehicles). Japan manufactures ~9 million units. But perhaps here to also consider that Japanese companies overseas production is ~17.5 million units.
In terms of exports, Germany is the world leading car exporter with $149 billion, followed by Japan at $89 billion (2022, cars only). But recent data shares that in terms of number of vehicles, now China has surpassed Japan. China – 4.91 million vehicles exported in 2023, to Japan’s 4.42 million vehicles in 2023. So far in the recent decade, Japan had been the largest exporter by numbers. Cars are incidentally, the fourth most exported category (value) in the world.
Two notes here – Like other sectors, perhaps the boom in global GDP can owe itself to the rise of China in almost every sphere of consumption and production. Second, that many companies own international factories make the definition of exports and domestic consumption fluid – and hence this data is just directional.
In terms of key Japanese companies in the sector:
“The four major players or the Big Four in the automotive industry ate Toyota, Honda, Nissan and Suzuki. Then follows companies like Mitsubishi, Daihatsu, Mazda, Subaru, Isuzu and Lexus.”
Toyota as a company is the largest manufacturer of cars in the world. It sold over ~10 million units in 2023. Volkswagen (Germany) is the second largest with ~9 million units. Honda, global number 8 in terms of unit, is the second largest Japanese automaker with ~4 million units sold in 2023. Next is Nissan with ~3.3 million units. Still, if one considers the largest automaker in terms of market value, it is Tesla (though only 1.8 million units) with a market cap of $1.35 trillion. Toyota has a market cap of $238 billion with a revenue of $312 billion.
And yet, on one end is Japan’s position in the world as an automobile maker. And on another is Tokyo. Tokyo is a car-free city of sorts where only 12% of commute happens through cars. It is one of the distinctive features of Tokyo, relatively quiet residential areas and a buzzing city below the road levels where across two inner subway lines, 9 million passengers commute daily (almost 40 million if the larger city is considered).
“It may come as a surprise that Japan is home to the world’s biggest relatively car-free city. After all, Japan is the country that gave the world Mitsubishi, Toyota, and Nissan, and exports vehicles all over the world. And in fairness, a lot of Japanese people do own cars. Overall car ownership in Japan is about 590 vehicles per 1,000 people, which is less than America’s rate of about 800 per 1,000, but comparable to a lot of European countries. On average, there are 1.06 cars per household. But Tokyo is a big exception. In Tokyo, there are only 0.32 cars per household.”
23. Capsule context of Japan’s history
“Japan has about two millennia of recorded history which proceeded from rice cultivation to warfare among small states and national unification under Emperor. Then decentralization began, samurai emerged, feudalism was installed and industrialization and modernization started in the nineteenth century under Western influence.
Throughout its history, Japan also experienced periods of relatively tranquil internal evolution and periods of dynamic change under strong external influence. These periods alternated to create Japanese society in a multi-layered fashion.
Major external impacts on Japan included the following:
Rice cultivation—introduced from the Eurasian Continent around the third century BC (recent evidence shows that arrival of rice cultivation may have been earlier).
(Meanwhile, internally in Japan: In Shinto, Japan’s oldest religion, people identify kami (divine forces) in nature and in such human virtues as loyalty and wisdom. Between 100-300 AD, local clans form small political units.)
Buddhism—brought from China via Korean Peninsula in the sixth century AD.
Chinese culture and political system—imported vigorously from the seventh to the early tenth century AD.
(Meanwhile, internally in Japan: Periods of Asuka, Nara and Heian (seventh to twelfth century) – period of emperors, strengthening of Imperial Courts. Also, Buddhism, in combination with native Shinto beliefs, continues to flourish.
Late 12th century – Kamakura military government established. Followed by Takauji (Kyoto)’s military government from 1333 to mid-sixteenth century.)
First direct contact with Europeans (Spaniards and Portuguese)—guns and Christianity arrived in the sixteenth century AD.
Meanwhile, locally: From 1467 to 1568: The 100 year-long Onin no Ran (Onin War) brings disintegration of central government. Oda Nobunaga starts process of reunifying Japan followed by Toyotomi Hideyoshi. Foundation of modern Japan is laid. The country was eventually reunited in the late 1500s, and a rigid social caste system was established during the Edo Period that placed the samurai at the top, followed by the farmers, artisans and merchants respectively.)
Isolation – during the Edo period (from 1603 to 1868), relations and trade between Japan and other countries were severely limited, and almost all foreign nationals were banned from entering Japan, while common Japanese people were kept from leaving the country.
Modernization—second contact with the industrialized West in the nineteenth century.
Post-WW2 reforms—under US occupation, defeated Japan was transformed into a non-warring capitalist nation.”
24. Defense in Japan
After the Second World War and during the occupation by Allies, Japan renounced war in the constitution if was drafting.
“Article 9. Aspiring sincerely to an international peace based on justice and order, the Japanese people forever renounce war as a sovereign right of the nation and the threat or use of force as means of settling international disputes. In order to accomplish the aim of the preceding paragraph, land, sea, and air forces, as well as other war potential, will never be maintained. The right of belligerency of the state will not be recognized.”
Since, Japanese miltary spend has been mainly for Self Defense. And until a couple of years, it capped defense spend at less than 1% GDP. That changed over the last few years, when in 2017 Shinzo Abe declared the shift from the ceiling of 1%.
“In Abe’s four years as leader, his government has reinterpreted the pacifist constitution to allow Japanese troops potentially to fight overseas, eased curbs on military exports and erased the defence-budget cuts of previous administrations.”
In Dec 2022, the budget announced for Japanese Self-Defense Forces was $52 billion, the largest yoy increase in planned spending since 1952. This budget was the first year under the new Japanese National Defense Strategy which plans to increase Defense and Other outlays to upto 2% of GDP.
By comparison, the global defense spend is $2.43 trillion. US spent $916 billion in 2023 or 3.4% of GDP and 37% of global spending, China allocated $296 billion to military or 1.7% of its GDP. India with $84 billion (2.4% GDP) is the fourth largest spender after Russia which allocated 6.3% of its GDP to military. Japan is the tenth largest defense budget in the world.
In 1960s, acting in accord with its constitution, Japan took over defence-export restrictions to limit arm exports to certain countries including those involved in conflicts. So even though Japan is one of the larger suppliers of high-tech products and has presence in all markets of sophisticated tech, it is largely absent from global arms markets. The recent changes in the Japanese defense architecture are shifting some things to revive the local defense industry as well. So far, the export restrictions and a capped domestic defense market has kept the scale of Japanese defense companies small compared to other global leaders and relative to Japanese companies in other high-tech sectors. Most companies do both defense and civilian business, creating dual-use technology.
Also perhaps, worth noting in a nuclear-armed world:
“The 1945 atomic bombings of Japan by the United States left an indelible impression on Japanese society. Japan does not possess any programs for the development of weapons of mass destruction (WMD), but it is the only non-nuclear weapon state in possession of a full nuclear fuel cycle and has advanced WMD-relevant industries.”
For context, the world has around 12,100 nuclear warheads (~90% belonging to US and Russia). And this number is a decrease from ~70,000 during the cold-war.
25. Nobel Prizes and Japan
While we were there, the local newspapers seem to discuss a lot about expectations on the Nobel front in sciences and ensuing disappointments this year. The 2024 Nobel Peace Prize was awarded to Nihon Hidankyo (The Japanese Confederation of A- and H-Bomb Sufferers Organizations)
“The Nobel Prize is considered the highest honor in the academic world. This is true in the United States and Europe, and especially so in Japan: The Japanese government automatically awards the Order of Culture─the highest civilian medal in Japan─to each Japanese laureate of the Nobel Prize. No other country goes quite so far to celebrate their Nobel laureates.”
Japan has been awarded 30 -32 Nobel Prizes. (Depending on how Japanese born people are counted). So far, Japan has had two Nobel laureates in literature – Yasunari Kawabata and Kenzoburo Oe. Kazuo Ishiguro, another literature Nobel laureate was born in Japan. And ~30 others in various sciences and two Peace Prize. “Of Japanese winners, twelve have been physicists, eight chemists, three for literature, five for physiology or medicine, and two for efforts towards peace.”
In terms of Nobel statistics, there have been 800 Nobel prizes awarded till date. And so far “there have been 63 Asian winners of the Nobel Prize, including thirty Japanese, twelve Israeli, nine Indian (not including non-Indian Laureates born in India) and eight Chinese (not including non-Chinese Laureates born in China).” So far, United States people have received 420 Nobel Prizes, 142 in UK, 115 in Germany, 75 in France, 34 in Sweden and then Japan.
“In terms of the Order of Culture, it may be awarded to men and women for contributions to Japan’s art, literature, science, technology, or anything related to culture in general; The order is conferred by the Emperor of Japan in person on Culture Day (November 3) each year.”
In 2024, it was awarded to seven people, including manga artist Tetsuya Chiba. It is the first time that a manga artist has been selected for the order.
Perhaps here another indicator worth mentioning is the number of scientific & engineering papers/articles published by a country (basis Scopus database). Japan used to be one of the largest (2nd largest) before 2000. Of late, it is now sixth largest with 103k papers/articles published in 2022. Here again, China, which published 329k in 2012, published more than twice, 900k in 2022. US is the second largest with 457k papers. In 2022, this global consideration set was total 3.3 million articles. (For comparison, there were 1.2 million such articles in 2003, with Japan still producing 101k articles then, US 336k, China 88k). Around half the papers published in Japan are in health sciences and biological and biomedical sciences (47%). In China, 25% of papers are in the field of engineering.
26. Bookstores in Japan
Although to someone who does not read Japanese or understand Japanese, the bookstores have very little to offer (Still I feel it is plenty if you are new to Japanese literature, enough to keep you busy for a few months), but the bookstores there are a sort of feast to any enthusiast for books or bookshops. From 9-floored Kinokuniya in Shinjuku (perhaps the first one) to the huge Tustaya, (especially in a country with tiny, compact houses and restaurants, these large book spaces are a delight), it is generally a pleasure to walk around the aisles and look at the wealth. And not just big stores, a walk around Jimbocho is perhaps unique in the second-hand book world with not one big store offering everything but a large number of little stores offering selections. (The reader of English can just about feast with eyes at the splendour, almost nothing to buy there).
Still, keen to note the vibrant presence of bookstores almost everywhere, especially in these times of shutting down of bookstores or large chains, it was refreshing to see the hustle and bustle in these spaces. If I look for number of bookstores in different countries, many countries seem to have a high number of bookstores. Some cities are much more popular for the bookstores they have per capita. For example, to Japan’s 11,500 bookstores (number reduced through the decade itself from ~20,000 in 2004), US has 10,800 bookstores. UK has over a 1,000 and France 3,500. China has perhaps over 70,000.
Perhaps a more relevant statistic is revenue. To compare size of chains, Barnes & Noble (US) reported revenue of $1.57 billion across 627 stores, Books Kinokuniya reported revenue of ~$890 million across 56 Japan and 37 international outlets.
In terms of total country reported revenue, US reported $26.2 billion as publishing industry revenue in 2022, the highest in the world, to Germany’s $9.9 billion, Japan’s $9.3 billion and India’s $9.1 billion. (Not sure about China total. S.Korea is ~$6.7 billion). (28 countries that report revenue total to upto $76 billion). What stands out in these numbers is that trade sector is around ~93% of Japan’s publishing revenue (rest being educational), to 66% trade sector in the US, 80% in Germany, and 3.7% in India (rest being educational sector). In Korea and UK, trade sector is 50-55%. So a significant portion of Japan’s publishing revenue is from trade.
“In Japan, the publishing industry figures include magazines–Japanese bookshops usually carry a wide range of magazines, which is perhaps different to the US and UK, where supermarkets play a larger role.”
Perhaps something to note here that Japan is one of the largest print circulation markets in the world and is home to some of the largest circulated print newspapers. The model for newspapers is generally subscription based. In Japan, only 22% of publishing revenue is through online channel, the key channel being brick and mortar. In the US, ~30% is from online channel (of a much larger market), in UK it is 59%.
In terms of revenue by format though, Japan leads the charts on proportion of digital/audio at 43% of total publishing revenue, perhaps mainly driven by digital manga which makes up for 30% of total sales now (up from 5.2% of total sales in 2014).
“Once almost completely unknown to the world outside Japan, manga (Japanese comics) and anime (Japanese animation) have become a global phenomenon – and their popularity is growing every day. While the Japanese word “manga” refers to comics in general and is often translated as “whimsical pictures,” outside of Japan, the term is usually used to denote comics specifically produced in Japan or following a certain style that was developed in the country as a mixture of Japanese and foreign influences. The medium makes up more than one-third of the publishing market in Japan.”
The Manga market was $7 billion market in 2023 in Japan, with Japan home to 52% of global revenue. Manga is popular in other markets as well, with ~$935 million from North America and $2.6 billion from China.
Perhaps here a little about the rest of Japanese literature as well:
“Japan lacked a writing system before the introduction of kanji from China. In the fifth century, kanji found its way to Japan via the Korean peninsula, marking the emergence of the oldest historical records known as the Kojiki (712) and Nihon Shoki (720). These influential works were dedicated to capturing the essence of ancient Japanese mythology, folk songs, and historical accounts.”
And yet,
“Japan is home to one of the oldest existing printed works in the world, the Hyuakumantō darani (“Mantras of the Million Pagodas”), produced in 770 ce.”
..
“Both in quantity and quality, Japanese literature ranks as one of the major literatures of the world, comparable in age, richness, and volume to English literature, though its course of development has been quite dissimilar. The surviving works comprise a literary tradition extending from the 7th century ce to the present; during all this time there was never a “dark age” devoid of literary production. Not only do poetry, the novel, and the drama have long histories in Japan, but some literary genres not so highly esteemed in other countries—including diaries, travel accounts, and books of random thoughts—are also prominent. A considerable body of writing by Japanese in the Chinese classical language, of much greater bulk and importance than comparable Latin writings by Englishmen, testifies to the Japanese literary indebtedness to China. Even the writings entirely in Japanese present an extraordinary variety of styles, which cannot be explained merely in terms of the natural evolution of the language. Some styles were patently influenced by the importance of Chinese vocabulary and syntax, but others developed in response to the internal requirements of the various genres, whether the terseness of haiku (a poem in 17 syllables) or the bombast of the dramatic recitation.”
27. Nintendo
I guess any writing about Japan would be incomplete without the mention of Nintendo. Headquartered in Kyoto, for enthusiasts there is a Nintendo museum as well. And for fans, a host of Nintendo stores, Superstores and Pokemon stores and cafes and Kirby Stores spread across Japan. It even has a collaboration with ANA where entire planes and flights are Pokemon themed. So if one travels with a child or a teenager, or perhaps is interested in Pokemon, one cannot visit Japan without stopping at one of their stores (and keep marvelling at the endless cash-counter queues!).
Nintendo (market cap of $76.21 billion) is perhaps one of the oldest large gaming console companies still doing well. Set up in 1889 as a company making playing cards, until the 60s, it was primarily selling cards. In 70s, it developed entertainment systems and arcade gaming machine. (During 1970s, the gaming industry revenue was primarily arcade revenue with some console revenue. By 1980s – total global Arcade revenue was $40 billion, and console $20 billion). In 1989, Nintendo launched the hand-held Game Boy. In 2009, Nintendo’s revenue was $18.8 billion, and in 2021, $16 billion.
Nintendo is the world’s fourth largest gaming company at the moment with revenue of $11 billion in FY24 (much lower than previoud decades annual revenue). Largest being Sony, another Japanese company which makes PlayStations. Sony caters to many other fields than gaming, recording a total revenue of $88 billion (2024), of which $27.5 billion was gaming console revenue. This gaming revenue at Sony used to be $7.6 billion in 2007, almost half of Nintendo then. Sony is not just one of Japan’s largest electronic companies, it is also one of the top 100 companies in the world by revenue. The other top three gaming companies are Microsoft Gaming with $21.5 billion revenue and Tencent which records $25.5 billion revenue.
But because Nintendo has the long history, in terms of all time console sales, it has three devices in the global top 5 – Nintendo DS, Game Boy and Nintendo Switch. In terms of lifetime console sales, Sony “PlayStation 2 sold over 160 million units across its lifetime. Nintendo DS sold over 154 million units, and Nintendo Switch over 146 million units. By comparison, Microsoft X Box one has sold ~58 million units.”
Console sales is a $33 billion market from a total $165 billion gaming revenue. (not including ads and media). (2020 stats). Game Publishing market is ~$43 billion.
Perhaps to put these numbers in context, and to show their significance in the modern entertainment market, following is indicative data from globalstats : Global television generates ~$400 billion revenue annually (including broadcast, cable, digital platforms). Video Games is ~$200 billion revenue (console, PC, mobile games). Streaming services provide ~$200 billion revenue (Netflix etc). Casinos and Gambling generate ~$130 billion revenue. Sports is a ~$120 billion revenue industry (tickets, sponsorships, broadcasting, licensing). Film industry ~$100 billion (box office, home entertainment and digital distribution). Publishing generates $80 billion annually (books and periodic publications). Music industry is $60 billion (streaming, physical sales, live performances and licensing). Live Events is $30 billion. Theme Parks is $25 billion business annually.
Incidentally, Sony is also a leader in the music publishing industry. Its revenue of $10.8 billion constitutes c.25% of the music publishing revenue. What to me was a startling fact is that gaming as a market/revenue has long surpassed music and movies industry. (Box office revenue $26-30 billion, Music records sale – $26billion)
And while we are talking about electronics, although of the gaming nature, here is a little history on Japan’s electronic prowess:
“From the 1960s to the 1980s, innovative products such as transistor radios, color televisions, and video cassette recorders (VCRs) emerged, earning worldwide recognition for the “Made in Japan” quality. During this period, companies like Sony, Panasonic, and Sharp became synonymous with technological innovation. However, the advancements of globalization in the late 1990s allowed Korean and Chinese companies to capture market share, momentarily placing Japanese firms in a difficult position. In response to these challenges, the Japanese industry advanced product functionality, improved quality, and invested in environmental technologies. As a result, their competitive edge in the market has been reinforced.
Currently, Japanese manufacturers have established a strong position in the global market, particularly in the production of semiconductors, sensor technologies, and electronic components. The projected global production value of the electronics information industry for 2024 is approximately 527 trillion yen ($3.3 trillion), with Japanese companies accounting for about 41.5638 trillion yen ($260 billion). According to the Electronic Components Association, Japanese companies held an 8% share of the global electronics information industry’s production value in 2023, with Japanese component manufacturers securing about 33% of the market share in electronic components”
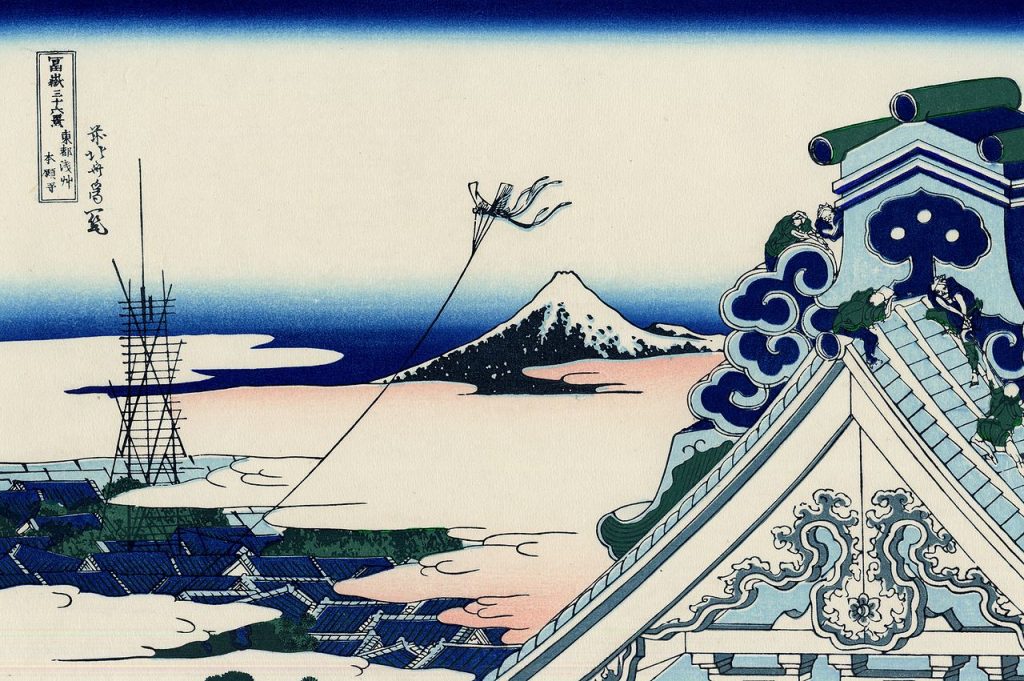
28. Movie Industry in Japan
Japan is the world’s third largest box office market with box office revenue of $2.4 billion. US is the largest with $10.3 billion, followed by China with $9.3 billion in box office revenue. With close to ~195 million admissions, it ranks 8th in the world in terms of number of people showing up for movies.
Japan has one of the oldest film industries in the world as well. Movies have been produced in Japan since 1897.
Perhaps an aside here is the number of movies released globally. The year 2007 marked a year when more than 1,000 movies were released globally. Until 2000, it used to be ~500 movies every year. Over the last decade to fifteen years, the number of movies released globally has climbed higher with close to 5,500 in 2024. Perhaps this signals to the changing way movies are seen, and also the way different countries’ local movie production is evolving. Perhaps to compare, the worldwide box office revenue, after climbing to $38 billion pre-covid, is at ~$22 billion for 2024, pretty much at the same level as 2008 when one-fifth the number of movies were released globally.
“Some notable Japanese films include Akira Kurosawa’s “Seven Samurai,” Hayao Miyazaki’s “Spirited Away,” and Yasujirō Ozu’s “Tokyo Story.” These films have had a significant impact on the film industry both in Japan and around the world. Japanese cinema is known for its unique storytelling, stunning visuals, and innovative animation techniques. Anime, a style of animation that originated in Japan, has become a global phenomenon, with films like “Your Name” and “Weathering with You” gaining international acclaim.”
In late 1960s, there were 7,000 movie screens in Japan. And by 1993, it was down to 2,000 screens. Since then, multiplexes were introduced in Japan. At the moment, there are over 3,600 screens in Japan. But like the rest of the world, total admissions in Japan has still not reached pre-covid levels.
In 2023, 1,232 films were released in Japan, of which, 676 were Japanese and 556 imported. 67% of receipts were Japanese gross receipts. What is perhaps interesting about it is that in late 90s, this split used to be the other way around (more receipts by international/ Hollywood and non-Japanese films).
The other famous Japanese entertainment form, anime, accounted for 6% of global streaming revenue in 2023. Total 2023 video streaming revenue in the world was $96 billion.
“Japanese anime captivated global audiences in 2023 like never before, achieving record-breaking revenues and expanding its cultural influence worldwide. Anime generated $19.8 billion in total global revenue in 2023, including $5.5 billion from streaming and $14.3 billion from merchandising. Notably, 41% of anime’s streaming revenue originated from North America.”
Perhaps what is unique about anime is its ability to tap the relatively low revenue-stream of merchandising. May be the only comparable here is Star Wars, which has over time achieved a high revenue from merchandise sales – cumulative over $32 billion (against box office revenue of $10.3 billion). Also for further context of that merchandising number, the total North America movie merchandising market was $13 billion (~2024).
The interesting network of manga (illustrated book), anime (animation – animated movies, live-action adapatations, videos, streaming and the character universe including merchandise), and video games fuels and propels each other, and has globally acquired cultural significance in the pop culture.
“Both Sony and Nintendo are leveraging anime aesthetics across their other content offerings and beyond. For Nintendo, this has included capitalizing on interest in animated characters from its games for big-budget film productions like 2023’s The Super Mario Bros. Movie and for a new area at the Universal Studios Japan theme park in Osaka.
Video games accounted for a majority of Japan’s content exports in 2022, well ahead of anime, movies, television, and print publications. The government is aiming to more than quadruple content exports by 2033 to JPY 20 trillion ($132.5 billion) from JPY 4.7 trillion ($31.1 billion) in 2022. Gaming is also adding fuel to Japan’s visitor flows and tourist spending, which both appear on track to reach new annual highs in 2024.
Meanwhile, thanks in part to its Super Nintendo World area, which opened in 2021, Universal Studios Japan was the most visited amusement park outside the US last year, according to the California-based Themed Entertainment Association.”
Not only for manga, anime, video games, theme parks, but in terms of music as well, by some accounts:
“Japan is the second largest music market in the world. Total revenues of the music industry are estimated at $7 billion, generated by 3 main sub-industries: live, recording and publishing. Over 90% of all live and recording revenues come from domestic acts, while publishing is considered the most foreigner-friendly part of the industry with 20-25% of revenues generated by international artists.”
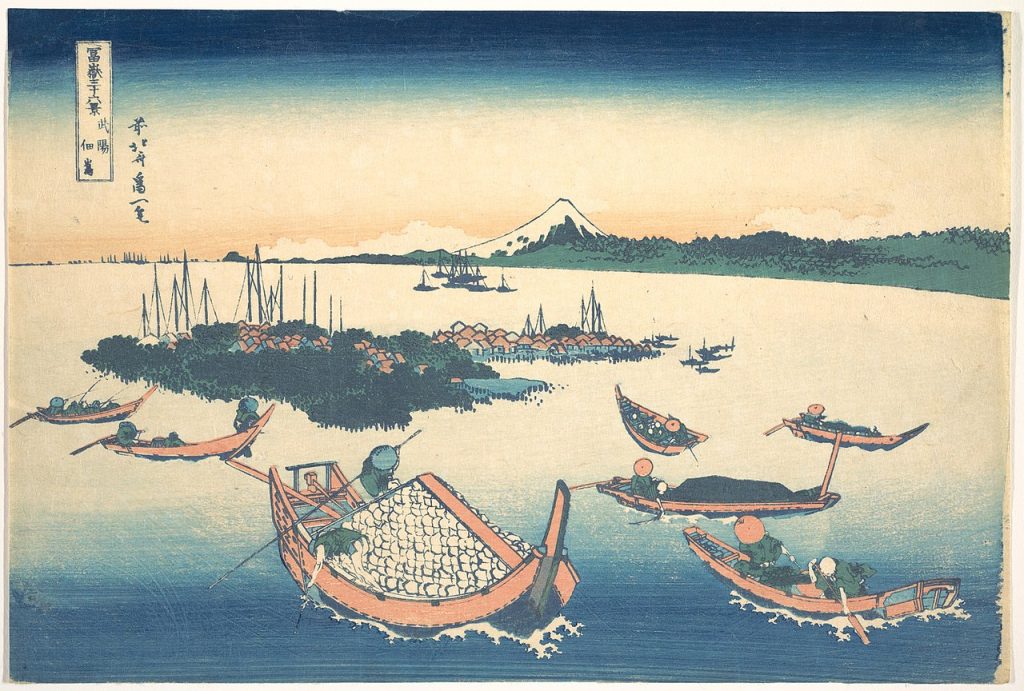
29. Shipbuilding in Japan
The global shipbuilding industry has a revenue of $236.4 billion. Japan is one of the leading players globally along with China and South Korea.
Being an island nation, Japan has traditionally been making ships and boats, for fishing and its proximity to China and need for voyages helped the industry. The twentieth century saw the shipbuilding modernisation, the wars devastated the industry, and yet, by 1956, Japan had overtaken Britain to become the largest shipbuilding nation in the world. With that began what people now call the golden age of Japanese shipbuilding which lasted for decades. This ranking lasted for a long while until 2-3 decades ago, when the opening up of China changed the dynamics for many industries in the world (from 6% global share in 2001, it is c. 50% in 2023). Meanwhile, Japan’s share has declined from 35% in 2002, to ~17-18% in 2022. (Although to note that in terms of total output, the CGT has gone up, signifying significant growth of the market itself)
“The mantle of the world’s leading shipbuilder passed from the United Kingdom to Japan in the 1950s, from Japan to South Korea around 2000, and from South Korea to China in 2010.”
Given the rise of China and South Korea, the world has reached overcapacity in shipbuilding. However, Japan is still the top 3 shipbuilding nation in the world. Between China, Japan and South Korea, they cover 90% of the global shipbuilding market (in tonnage).
Imabari Shipbuilding is the largest shipbuilding company in Japan (Revenue ~$3 billion). It is one of the leading shipbuilders in the world (top 10).
But over the last few years, some of the larger Japanese players have exited the business. For example, Sumitomo Heavy Industries is the latest shipbuilding company to quit the commercial shipbuilding. Mitsubishi Shipbuilding Heavy Industries, Mitsui Engineering & Shipbuilding have all recently exited shipbuilding.
“Despite consolidation, even the most successful shipbuilding firms in Korea and Japan often operate at a loss. According to an annual market review, ship sale prices seldom exceed their building costs. Korean and Japanese shipbuilders are traditionally part of large manufacturing and financial conglomerates (e.g., Samsung, Hyundai, Mitsubishi, Kawasaki) where other profitable segments can help weather the poor profitability of their shipbuilding sector. Even so, Korean shipbuilders have repeatedly required large government bailouts, which have prompted World Trade Organization disputes from Japan and Europe. In China, 36 of the 100 largest shipyards are owned by the national government, 10 are owned by local governments, and 54 are privately owned. The government-owned yards accounted for 64% of ship tonnage built in China in 2021.”
Part of the shipbuilding in Japan feeds to the local demand. In terms of the fleet value itself, Japan has the largest fleet ($206 billion) in the world. Japan has had the largest fleet for a while now. Followed by the rapidly expanding fleet of China at $204 billion. Greece is third largest and USA with c.$100 billion at fourth. Although to note that half of the US fleet is cruise related (the largest cruise fleet in the world). Japan holds the largest fleet for LPG and LNG vessels. And has the largest fleet for vehicle carriers – 334 vessels of $22.9 billion. China has comparable fleet on bulk, and larger on container (1,011) and tanker vessels (1,576).
“Japan remains as of today the third largest shipping country after China and Greece. The country comprises 102 major ports, 5 international strategic ports (of international importance), and 18 international hub ports (used to provide quick access to airports, roads, and railways).”
Japan is a leading player in international trade, and given that it is an island, this trade is largely ocean based. In terms of throughput trading through its ports, Japan is the sixth highest (China, beyond the charts, then followed by US, Singapore, Korea, Malaysia). To China’s 269 TEUs (2022), Japan had 22.5 TEUs. Shipping itself has seen a change over the last half-century. It increased from 2.6 billion tonnes in 1970 to around 12.3 billion tonnes in 2023.
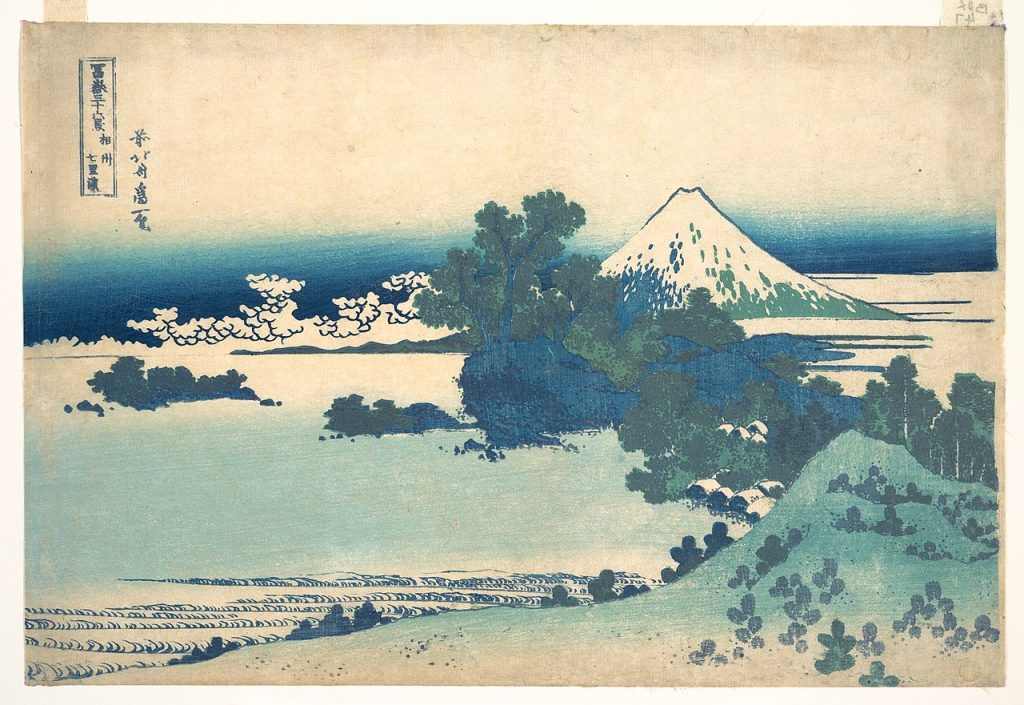
30. Volcanoes and Mount Fuji
Japan is located along the western edge of the Pacific ring of fire which surrounds most of the Pacific Ocean. “Roughly 90% of all earthquakes occur along the Ring of Fire, and the ring is dotted with 75% of all active volcanoes on Earth.”
It is estimated that about 10% of the world’s volcanic activity takes place in Japan.
In terms of world’s active volcanoes, 55 are located on Indonesia, 40 in Japan, 39 in the US (mainly Hawaii, Alaska and Pacific Islands), 27 in Russia (mainly Kamachatka peninsula).
About 70% of Japan is mountainous. And it has one of the higher forest covers for a developed country (68.55%). Perhaps there are only a few countries in the world which are forested like this. The only other developed comparable countries are Finland and Sweden.
Mount Fuji is an active volcano which last erupted in 1707. It is located 100 kms southwest of Tokyo and on clear days is visible from Tokyo.
“Mount Fuji — locally called Fujisan or Fujiyama — is Japan’s most famous natural landmark and among the best-known mountains on earth. Revered as a sacred natural deity and appreciated for its graceful form, Fuji has served as an inexhaustible source of inspiration for over a millennium. It is admired as an icon of strength, harmony, and longevity. “Ever since heaven and earth were parted, it has towered lofty, noble, divine,” wrote Yamabe no Akahito, as documented in the oldest collection of Japanese poetry.
Reaching a height of 3,776 meters (12,389 feet), Fujisan is the tallest peak in mountainous Japan, as well as one of the nation’s sanreizan (“three holy mountains”) — along with Tateyama and Hakusan. It is located in the central island of Honshu, straddling the prefectures of Yamanashi and Shizuoka, just west of Tokyo. The mountain can be seen from over 300 kilometers (186 miles) away, visible in 22 of the country’s 47 prefectures. It is a national icon, often called the soul of Japan.”
..
“Mt. Fuji is arguably the most perfect volcanic cone in existence,and has long been cherished in Japanese legends, No drama, and religious worship as the supreme, sacred peak that holds the secret of immortality in its depths. Unlike other famous high-elevation mountains in the world, Mt. Fuji is not part of a large mountain range. It stands alone, in all its magnificence.“
..
“Katsushika Hokusai (1760-1849) was seventy years old when he began his quest to depict Mt. Fuji in all its seasons and aspects. In the next five years, he created forty-six designs (ten more than needed) for the print series, Thirty Six Views of Mt. Fuji (pub. ca. l829-1833), and 102 designs for the printed book, One Hundred Views of Mt. Fuji (pub. from 1829-ca. 1847). The specific order and dates of these prints are not known, but the geographic or narrative sequence of scenes seems to be of secondary importance compared to the true subject: the constant presence and transcendent nature of the lofty peak in all manner of viewpoints.
Hokusai was one of the most influential artists of the Japanese Edo-period (1600–1868) art movement known as ukiyo-e, or pictures of the floating world. He was an eclectic artist who, over a period of more than seventy years, created a huge body of work that drew together myriad influences, including Western techniques as well as traditional Japanese and Chinese elements.”
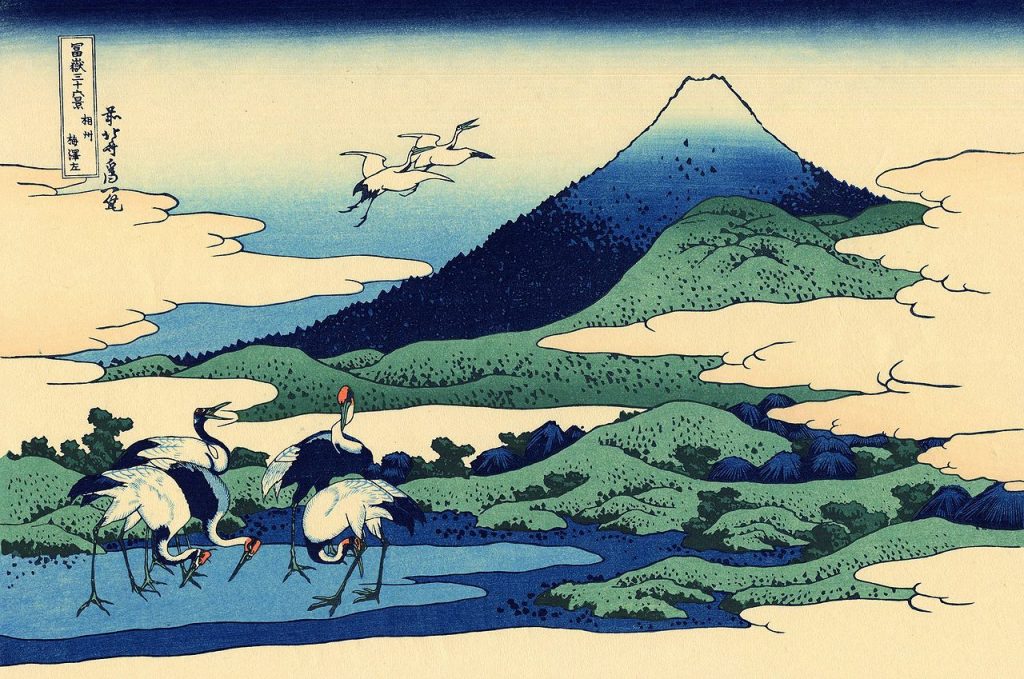
31. Tourism in Japan
As a tourist, one saw the crowds in all tourists hotspots. And the quiet queuing up was accepted as the way to be a tourist. But just how much: December 2024 recorded the highest tourist arrivals in a month in Japan (3.49 million), this was from the previous highest of 3.3 million in October 2024. And for the entire year 2024:
“A record 36.9 million international visitors came to Japan in 2024, up 47.1% year on year. The figure announced by the Japan National Tourism Organization is 5 million more than the previous record of 31.9 million set in 2019, before the COVID-19 pandemic.”
The largest source markets from where the tourists arrive are South Korea, China, Taiwan, United States and Hong Kong. “The largest number of travelers in 2024 came from South Korea at 8.82 million, followed by China at 6.98 million, up almost three-fold from 2023, and Taiwan at 6.04 million.”
In terms of outbound tourism, 2019 saw 20 million visits by Japanese abroad. Most of this is in the region or South East Asia. Although this number has come down, and in 2024, it was ~13 million outbound travellers from Japan (which also reflects an impact of weak yen).
To put these numbers in the larger context, globally, around 800 million tourists travel internationally. (Another data point puts this number of international tourists arrival worldwide at 1.3 billion in 2023). So Japan is big, but not in the top 10. Globally, most visited destinations are France (100 million in 2023), Spain (85 million in 2023), United States (66 million in 2023), Italy, Turkey, Mexico. In Asia itself, China sees a larger number of visitors and then Thailand before Japan.
In terms of revenue from tourism, there are two sets of numbers to consider – receipts from international tourists, and the total tourism revenue for a country. The US leads the charts on both fronts. For 2023, total travel & tourism contributed $2.36 trillion to US economy. For China, another big market in terms of revenue, it is $1.3 trillion. Germany is next with $487.6 billion and Japan is next with $ 297 billion.
As a total travel and tourism industry (which includes local tourism too), Japan ranks 4th in the world in terms of industry size, signifying a lot of local travel and tourism. In terms of revenue from international tourism, for Japan, compared to other developed nations, it is quite little. The US is the largest recipient of international tourist dollars globally at ~$190 billion. (Even though France receives the largest number of visitors). Next is Spain with $92 billion. For Japan – the 2024 international travellers spent ~$50 billion.
“The government has set targets of 60 million international visitors and visitor spending of ¥15 trillion in 2030.”
Tourism is an important part of Japanese economy. Globally as well, travel and tourism is a big contributor to jobs and economies:
“In 2019, Travel & Tourism (including its direct, indirect, and induced impacts) accounted for 10.5% of all jobs (334 million) and 10.4% of global GDP (US$ 10.3 trillion). Meanwhile, international visitor spending amounted to $ 1.91 trillion in 2019.”
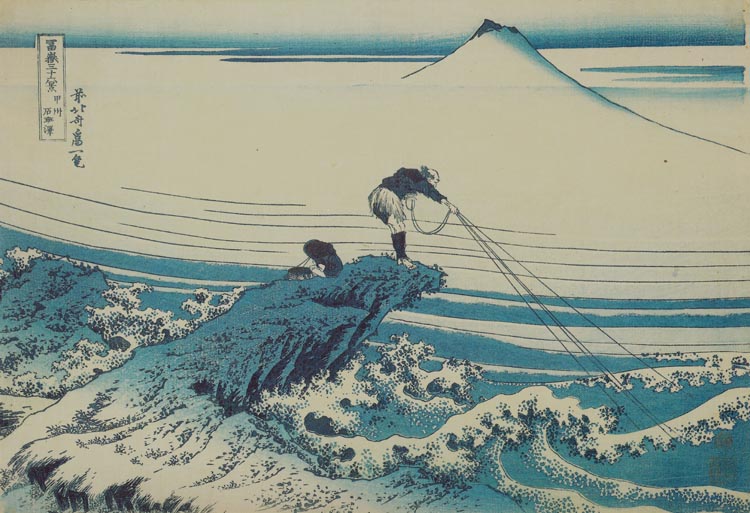
32. Cash in Japan
Very few developed or large countries are dependent on cash the way Japan is. Cash is still the preferred method of payment for in-person transactions. Things are changing, as they are around the world, but amongst developed economies, Japan has stuck to cash payments. Such that, over the period from 1995 to 2022, cash in circulation grew from 10% of GDP to 23% of GDP. In China, the corresponding number is close to 9% and in the US, close to 7%.
“Within Asia Pacific, Japan had the second-highest share of cash for in-person transactions at 51% in 2022 after Thailand, according to the US-based banking and payment processing company FIS. Meanwhile, in the US, the share of cash as a payment instrument has slipped, from 31% in 2016 to 18% in 2022.”
South Korea, China and Singapore have a cashless payment ratio of 94%, 83% and 60% in 2020. Where in Singapore, cashless payments per capita are over 700, Korea, close to 700, USA ~600, China ~300, Germany, over 300, Japan is at 100 per capita.
And even this is a significant improvement.“Meanwhile, cashless payment technology in Japan has made electronic transactions convenient and accessible. E-money debuted back in November 2001 with the launch of Suica, a prepaid rechargeable contactless smart card for use on the train network. It was subsequently popularised by the launches of digital payment platforms such as Pasmo – used for transportation, vending machines and in stores – and PayPal, which have made electronic transactions more accessible and reduced fees.”
From 13% cashless payment ratio in 2010 in Japan, it reached 39.3% in 2023. (84% of these cashless payments was through credit cards). To consider it in terms of value and household consumption, the total cashless payment was ~$900 billion in 2023, 39% of the household final consumption of ~$2.29 trillion. In April 2018, the government proposed ‘Cashless Vision’ which aimed to increase cashless to 40% of all transactions by 2025 (which seems to be tracking well), and ultimately to 80%.
Apart from Japan, perhaps here it is worth considering the cashless ratio in China, esp given its large population. If one looks at the largest digital wallets, AliPay with 1.3 billion users and WeChat Pay with 900 million users explain part of the reason. In contrast, Apple Pay has 507 million users, Google Pay 421 million and PayPal 377 million (data from 2022).
As to the reasons for this preference for cash in Japan:
“In our view, the factors contributing to Japan’s low cashless ratio include (1) the social climate: Japanese people prefer to use cash, and the volume of cash in circulation-to-GDP is much higher relative to other industrialized nations, with ATM usage (convenience) also high; (2) retailers’ perspective: retailers often avoid cashless transactions owing to the cost of installing payment terminals and the need to pay merchant fees; and (3) consumers’ perspective: a number of factors preclude greater uptake by consumers, including the presence of shops unable to process cashless transactions, concerns about overspending and security, and “general unease amongst older shoppers” “
Even with this, Japan has one of the world’s largest ecommerce market at $193.4 billion (2022). China is the largest with $3 trillion, followed by US at $1.1 trillion and UK at $195 billion, similar to Japan. In China, where the ecommerce sales are ~50% of total retail sales, it is 15-20% in US, 30% in UK and 13% in Japan (these % numbers vary with different sources). Global ecommerce sales are estimated at $6 trillion with ~19.5% of total retail sales. By some estimate, there are over 28 million eCommerce sites globally, with US home to half of these! The largest is Amazon. In Japan as well, the largest ecommerce player is Amazon Japan, followed by Rakuten Ichiba.
33. 7-Eleven Japan
Seven & I Holdings Co., which operates the number one convenience store chain in Japan is one of the major companies that have grown along with people’s daily lives as society developed in Japan. With its first convenience store launched 50 years ago in Japan, 7-Eleven operates ~21.5k stores in Japan.
“Japanese konbini (the abbreviated word for konbiniensu sutoru, “convenience store”) are quite different from convenience stores in other countries. They are no longer a late-night alternative to early-closing supermarkets, but a retail institution that millions of Japanese people could not imagine life without. Due to long working hours, short break times, and fast-paced modern life (especially in cities like Tokyo and Osaka), convenience is of the utmost importance in Japan. Japanese konbini make life a bit easier, with services such as Wi-Fi, bill payments, ticket reservations, ATMs, and scanners/printers, all in one place.”
At the moment, Japan has over 56,000 convenience stores or Konbinis belonging to seven chains which do a total business of ~$60 billion. Of these, 7-Eleven (21.5k stores in Japan), Family Mart (16.5 k stores) and Lawson(14.6k) are three industry leaders controlling over 90% of revenue, with 7-Eleven controlling ~46% of the total convenience store revenue in Japan.
It was not always so. Between 1991 and 2002, the number of convenience stores in Japan more than doubled from 19.6k to 42k. The meteoric rise of convenience stores in Japan in 1980s and 1990s, and eventual industry consolidation owes it success to a) business hours – open all the time all days of the year. b) early adoption of point-of-sale systems (7-Eleven was the first company in Japan to do use POS in 1982) which gave them access to customer data and c) ther innovative products and distribution systems, “for example the stores developed their own recipes for two traditional foods, o-nigiri (rice balls) and o-den (simmered foods). Employing a comprehensive, highly adaptable sales system, they began delivering refrigerated packaged meals and other food products to stores several times a day.” The operating efficiency of multiple stores had its negative effects on single store operators in Japan, and by early 2000s, top 10 chains accounted for 90% of Japan’s convenience stores.
The total value of all retail food and beverage sale was $198 billion in Japan in 2023, of which supermarkets represent the bulk at ~45% followed by convenience stores at ~30%. Ready-to-eat meals and take-home foods is a continued area of growth. By some accounts, Japan is the third-largest packaged food market in the world after the United States and China.
“The number of convenience stores have increased and are offering a wide selection of products such as ready-made meals and frozen foods, to make it easier for on-the-go consumers to quickly pick up food. This is more pronounced for the working class commonly referred as “salary men/women” who utilize konbinis throughout the day.”
Seven Eleven globally operates ~85k retail stores, around 40k stores operated directly – larger direct markets being Japan (21.5k) and US (12.5k), rest being franchised out. Its Japanese stores see ~22.3 million customers visiting them daily. It has over 10k stores each in Thailand and South Korea under franchise agreements.
Although 7-Eleven was originally founded in 1927 in Dallas, Texas, a majority shareholding was purchased by Seven-Eleven Japan in 1991, with rest of the 27% acquired in 2005. Given its strong presence (as the largest chain-stores) in the highly fragmented market of US convenience retail (where 60% of 150k stores are single-store operations, and the market is significantly larger with $327 billion from in-store sales), and its high-margin widely popular food business, 7-Eleven has been an attractive buyout target in the long term consolidation play in convenience store retail in North America, current media focus being on the approach by Canadian operator Alimentation Couche Tard with what is potentially the largest foreign buyout offer in Japan ($47 billion). Seven Eleven convenience stores Japan is a very profitable part of the business with EBITDA margins of ~36% compared to 7% in the rest of its direct operations (chiefly US) – this makes it a key player in the global consolidation play. However:
“Japan’s economy minister Ryosei Akazawa said that a potential foreign acquisition of Seven & i is an issue very relevant to the country’s economic security, as convenience-store operators can play a critical role, for instance, in distributing foods to those affected in the event of disasters.
In September, the Japanese government classified Seven & i as a company that engages in businesses critical to national security.”
In terms of global rankings, Seven and i holdings is the fifteenth largest retailer in the world with revenue of $76.91 billion (largest is Walmart with $572 billion, followed by Amazon with $239 billion and Costco at $195 billion). However, if compared in terms of group sales, Seven & i records ~$130 billion as group sales, and would perhaps rank seventh in the world with those numbers.
In terms of market cap, at $40.92 billion, it ranks in the top 25 global retail companies. (second in Japan after Fast Retailing’s $95 billion market cap. Fast Retailing owns Uniqlo, another Japanese retail success story).
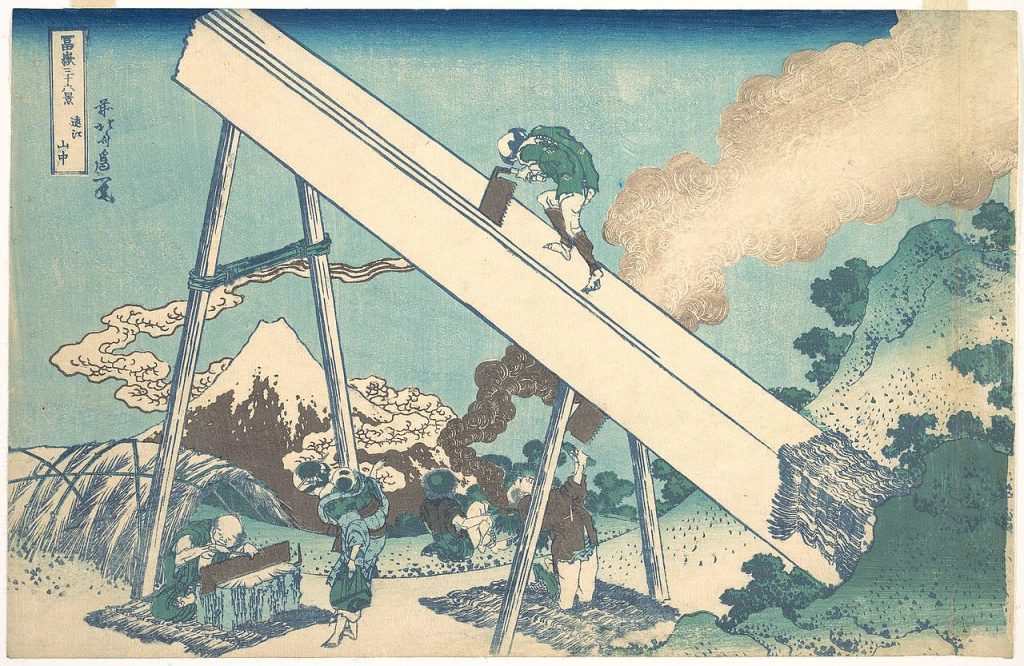
34.Vending Machines
One thing that is a common sight in Japan, strange and intriguing to a visitor is the sheer number and kinds of vending machine everywhere. Apart from the small convenience stores that are open late or for 24 hrs, there are these 24/7 vending machines almost everywhere.
There are apparently 5.5 million vending machines in Japan, one for every 23 people. And because it is highly urban, the perceived density of vending machines seems to be higher.
In terms of total vending machines, US has over 7 million vending machines, but with almost three times the population of Japan, this translates to 1 vending machine for 50 people. Also, the usage is different there, with most machines indoors. Japan vending machines seem to be everywhere – from temples, to street corners, to stations and all tourist attractions. They sell hot and cold beverages, and an array of products one doesn’t often expect to buy from a vending machine (fresh produce, flowers, crepes). These machines are quite innovative with efficient coin-payment systems. Japan is a relatively cash-based economy, and low level of vandalism and petty crimes allows the machines to flourish.
“Japan vending machines are mostly beverage machines; with more than 2.2 million different types of beverage machines (coffee machine, soda machine, etc.), this type of machine is by far the most popular among Japanese people. Since Japanese culture is heavily dependent on automated services, it is no surprise that automated machines are very common in the country. There are almost 1.3 million automated vending machines in the form of coin locker, money changer, etc. About 200,000 Japanese vending machines sell daily necessities, about 92,000 sell cigarettes, about 77,000 sell chips and other types of vending machine food (including hot meals), and about 63,000 sell tickets of some kind.”
Perhaps a word about Gachapon/ Gashapon as well. A sort of small lucky dip vending machine selling cute toys and trinkets in capsules. (Again, if you visit with a child/teen, you’ll not miss these). The most popular prizes revolve around anime and manga figures. There are heaps in Japan, and perhaps they are expanding to other countries as well. But some of these local, intriguing concepts go on to make Japan a different experience than other countries. Apparently Japan has over 360,000 Gachapon vending machines totalling to almost half a billion USD market.
In Japan, Vending Machines is a $8.5 billion revenue market against total convenience store market size of $60 billion.
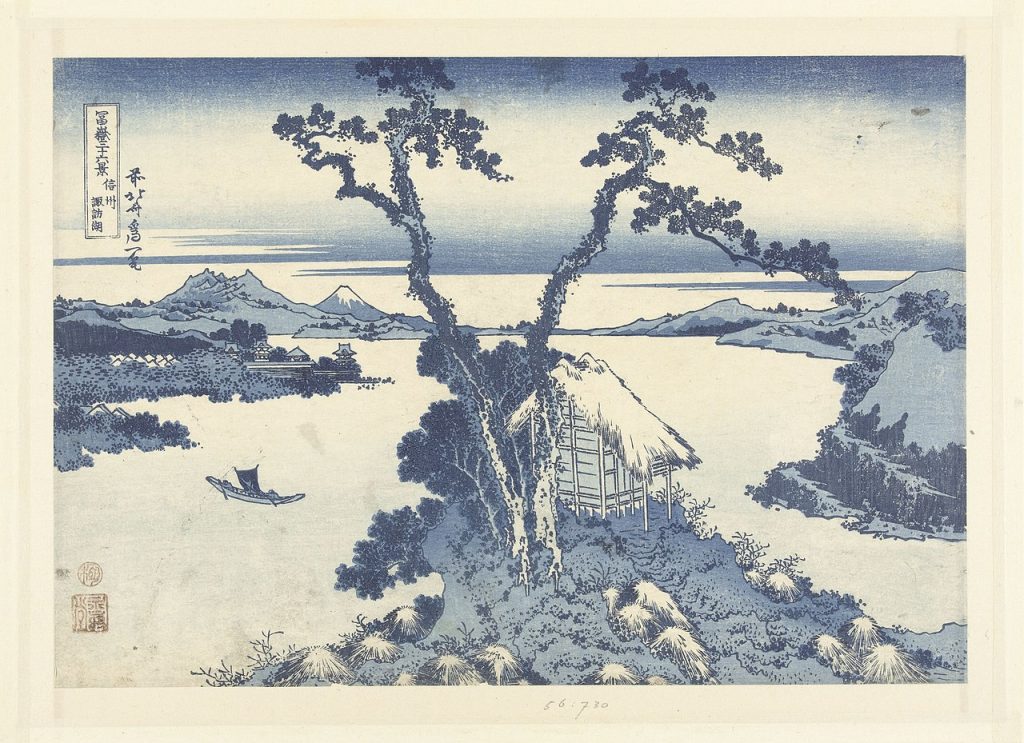
35. Certain aspects of Japanese culture
“The Japanese long have been intensely aware of and have responded with great curiosity to powerful outside influences, first from the Asian mainland (notably China) and more recently from the Western world. Japan has followed a cycle of selectively absorbing foreign cultural values and institutions and then adapting these to existing indigenous patterns, this latter process often occurring during periods of relative political isolation. Thus, outside influences were assimilated, but the basic sense of Japaneseness was unaffected; for example, Buddhist deities were adopted into the Shintō pantheon. Japan’s effort to modernize quickly in the late 19th and 20th centuries—albeit undertaken at great national and personal sacrifice—was really an extension of the same processes at work in the country for centuries.”
..
“Many aspects of traditional Japanese culture such as Taoism, Buddhism, astronomy, language and food have been profoundly influenced by China over the course of centuries. This remained a strong factor during the Nara period (through the 8th century), but after the 9th century, Chinese influence became weaker. A peculiarly Japanese strain of Buddhism arose in the 14th century, which came to be known as Zen Buddhism.”
..
“Zen Buddhists follow the teachings of Amida Buddha, which stress a life of contemplation and study, and in which contemplation of nature plays an important part. The purpose of the contemplative withdrawal from the world, however, is to renew the spirit in order to return to the world and serve.”
..
“The basis of samurai conduct is bushido, “the way of the warrior“. This unique philosophy valued honour, reckless bravery and selflessness, as well as duty to the warrior’s master with the purpose of giving up one’s life and embracing death. There was no place for fear in the way of the warrior and this conduct of self discipline and respectful, ethical behaviour was to become the role model behaviour for other classes throughout Japan’s history.
Not only were the samurai skilful warriors, but they were also expected to be highly cultured and literate; to be skilled in the harmony of fighting and learning. An ancient saying aspired to by warriors was bun bu ryo do: “the pen and sword in accord”, and it was common for samurai to enjoy calligraphy, tea ceremony, poetry and music, and to study.
From the thirteenth century, samurai conduct became heavily influenced by Zen Buddhism.
Zen complemented and influenced the way of the warrior and over four centuries Zen practices, such tea ceremony, monochrome ink painting, rock gardens, and poetry (haiku) introduced by monks were allowed to flourish thanks to these great warriors. Buddhist teachings had such an immense effect that as they became more ingrained in samurai life some samurai lost meaning in killing and gave up their sword for lives as monks.”
..
“In the heart of Japanese culture lies the principle of wabi-sabi, a philosophy celebrating beauty in imperfection, transience, and simplicity. This concept, rooted in Zen Buddhism, starkly contrasts the Western pursuit of perfection. Wabi-Sabi advocates for a deep connection to the natural world, where the beauty of the flawed and fleeting is acknowledged and honored. Wabi-sabi’s journey began alongside the development of the Japanese tea ceremony in the 15th and 16th centuries, blending the rustic simplicity of “wabi” with the serene beauty of aging “sabi.” It has since seeped into various facets of Japanese culture, from pottery and architecture to literature, serving as a guide to finding significance in life’s impermanent, incomplete, and imperfect aspects.
The Japanese practice that perhaps most exemplifies the spirit of wabi-sabi is kintsugi. Kintsugi is the art of golden joinery, in which broken objects – usually ceramics – are mended with gold-dusted lacquer.”
..
“One of the key cultural values is known as “Wa,” i.e. peace and harmony. The “Wa” concept derives not only from an inherent trust in people but also from an empirical knowledge. It is the belief that conflict will not pay and avoidance of its escalation will benefit those concerned in the long run. The propensities peculiar to the Japanese, collectiveness and strong loyalty to groups, both represent attitude towards behavior based on the “Wa” concept.
..
“Honne refers to true self or genuine feeling. In Japanese culture, someone’s true feelings are often kept private between themself and their closest circle. The purpose of this behavior is to maintain harmony in Japan’s group-oriented society. Instead of showing their real feelings, Japanese people usually use tatemae in public. Tatemae refers to the facade people put in front of others to please them or avoid confrontation. Tatemae usually contrasts with someone’s true feelings.”
Certain aspects of the Japanese culture translate to the workplace and corporate culture as well, foundational features of hierarchy, consensus, harmony and loyalty.
“Japan’s geographical feature also forms a basis of another propensity of the people: stability oriented, risk aversive and uncertainty avoidance. In practice, processes to get a consensus are made to avoid or reduce the risks arising from arbitrary decision, while it is in accordance with the “Wa” concept.”
“Loyalty to one’s company is paramount in Japanese society. Japanese employment protection is unique and dynamic compared to other nations. Many Japanese firms only promote from within; as a result, individuals may stay with the same company for their entire life. While some, especially older generations, view hard work as necessary and not something to complain about, the traditional work culture in Japan is known for its intensity, leading to challenges related to long working hours and “karoshi” (death by overwork). In Japanese corporate culture, dedication to one’s job and company is highly valued, fostering a culture of long working hours as a demonstration of loyalty and devotion.”
Beyond work, if you are a reader of Japanese literature, perhaps the following on Japanese art throws some contextual light:
“Delicacy and exquisiteness of form, together with simplicity, characterize traditional Japanese artistic taste. The Japanese tend to view the traditional Chinese arts generally as being too grandiose or showy. The more recently introduced Western arts are felt to suffer from flaws of exuberant self-realization at the expense of earnest exploration of the conflicts in human relations, in particular the notions of divided loyalties between community, family, and self that create the bittersweet melancholy so pervasive in Japanese traditional drama.”
..
“Aesthetic ideals have an ethical connotation and pervades much of the Japanese culture.” Perhaps, to close this note, here are seven aesthetic principles from Zen philosophy to instill that Japanese ideal of wabi-sabi and virtue:
“Fukinsei (不均斉): asymmetry, irregularity;
Kanso (簡素): simplicity;
Koko (考古): basic, weathered;
Shizen (自然): without pretense, natural as a human behaviour;
Yūgen (幽玄): subtly profound grace, not obvious;
Datsuzoku (脱俗): unbounded by convention, free;
Seijaku (静寂): tranquility, silence.”
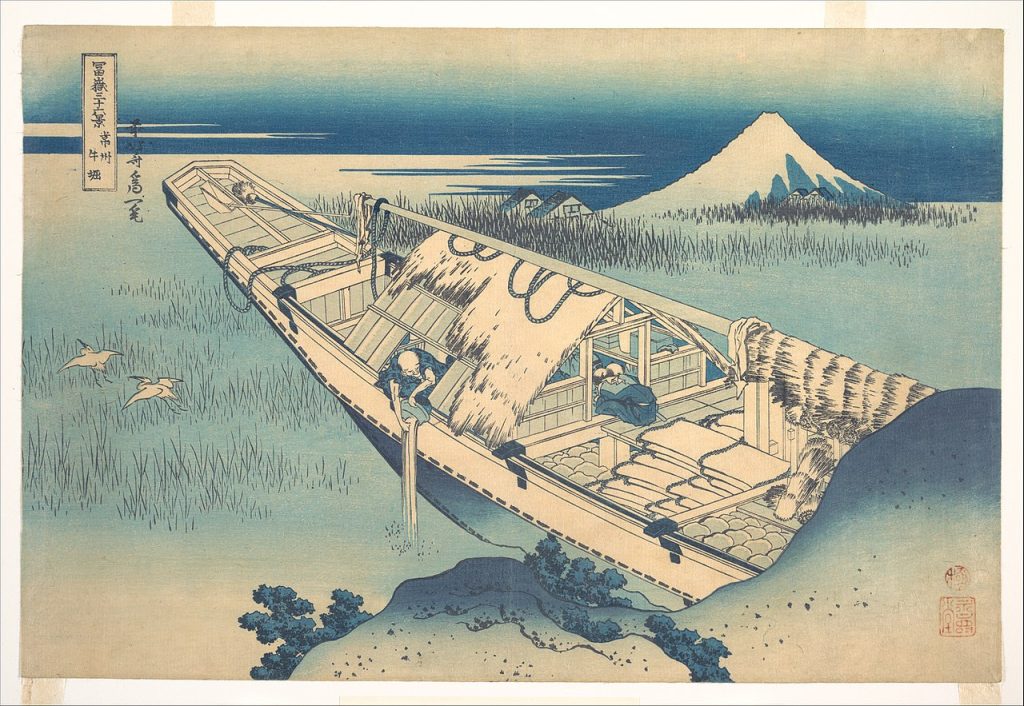
36. Personal notes & impressions
Following are a few general, personal notes and impressions. A little of the Japan that is not captured in the notes above.
..
Somehow, there, as a tourist, one always feels that one is on an island nation. Everywhere, there is a feel of an island country. Just some sort of undercurrent to things.
..
Also, one is struck by the amount of moss. Comparing it to wherever I have lived in the world, I am more used to grass. But in Japan, somehow, the grass doesn’t look that thriving (the way it looks elsewhere perhaps except Imperial Gardens where one cannot walk on grass anyway) – I am talking about general city/suburb spaces or even beautiful parks – they seem to have tough work with generally resilient and strong grass. But moss is beautiful everywhere. It has its own poetic beauty, like a different art medium than grass. It sort of takes care of itself, self-manicured, compared to the mowing needed in grass.
Also, the forests or trees seem to have an artistic feel to them. The thick dark trees, the twilight under the canopies, and forests are very different from perhaps where I live. Looking at the landscape one immediately comprehends all those Japanese prints with horizontal seeming branches on trees.
Another is the seemingly slower fall or autumn. We were there during the time of autumn leaves. Where I grew up, there was not much of leaves changing colour with seasons. But even here in the southern hemisphere, where leaves do change colour, what I see is often quick deepening, sort of consistent throughout the tree, or perhaps sections of a tree. What I saw there, it might have something to do with temperate zones, but a more gradual, slower, leaf by leaf gradation of colour rather than section by section or tree by tree more commonly found in Sydney winters. Within the same tree, one could see many colours. Perhaps that stage is more pronounced, spread over more time and hence more perceivable there.As if, the artist used a much finer brush and made a much more detailed work.
..
And though it is a developed country and very modern western, yet and yet, it is very much Asia – it is the strangeness of growing up as an Asian in an Asian context to seeing Asia in such a western setting. I don’t feel it in Singapore. Not even in HK. Not even in modern parts of India. It is the cultural thing, perhaps the way they behave that is just so Japan, and so western-modern and yet so non-Western (Western seems to be the rest of the developed world). From little things to its own Asian food to the deep current of culture which somehow struggles with the relatively Western idea of individuality and self-marketing. What it values. There is an individual but in Asia, perhaps the culture allows for happiness in being subsumed. One finds it different in the modern Western world where individual promotion comes across as aggression at times. One feels it as the unspoken undercurrent in Japan. The western looking country with all possible modern conveniences yet at heart so much, so much different than the western idea of an individual.
Perhaps it is really so. Perhaps it is not so. But it makes you wonder about the westernisation of the world and the limiting of the individual by our insistence on defining ourselves sharply.
..
The beautiful Shoji screens. Somehow the everyday is so lifted to the artistic, the beautiful by little things.
And the delight of a beautifully laid out plate of food – the delicacies of flavor, the color interplay all for the ephemeral few minutes for your consumption. Divinity perhaps resides in such things. (If you are looking for some poetic notes on Japan, here is a pdf – ‘Empire of Signs’ by Roland Barthes)
***
In many ways and while writing this note, looking at different industries, reading about Japan in fiction from Japan, this beautiful mix of east and west in Japan is different from the way rest of the world has adapted or mixed, it just seems so. And also perhaps it is displaced in time from rest of Asia, and yet so much like Asia, it is oddly confronting to the mind and the senses – the society having been there done that so much in the past, the memory in the system, and if you just go from your current now and here, it looks so alien, but if you look at how it has passed many cycles and learnt many lessons and arrived at what it has arrived at, there is a lot to learn from it, to absorb from it.
Much like a paradoxical puzzle, which one perhaps never tires thinking about, rather, is often refreshed by the conflicting perspective. On one end is the linear logic of now and here, and on the other, the circle of a paradox. I guess like Hokusai, one can keep going on, thirty-six is just one milestone.