Understanding Healthcare
Good health & wellbeing is perhaps the first freedom and requisite for a human being. As a society shapes up, and as the world itself shapes up and settles in definite boundaries with clearly defined government roles, healthcare becomes more and more a policy question, a scientific enquiry, a cost to government, and the first benefit to the population.
This post is my attempt to understand the space of global healthcare. I begin with a perspective on world population, the demographic and regional breakdown, try to understand what ails people globally. Then explore the healthcare systems and models prevalent around the world including the dynamics in different countries. The journey takes me to understand treatment (drug) development process, different players in this complex space where the relationship between patient, payer, provider is often not very logical. I end with some insights that this journey lends me.
It is a long post, an entry point to the vast field, to be absorbed slowly – the charts collected here illuminate and simply open doors to further exploration.
All the data, charts collected here are from several links, pdf available on the internet. I have tried to link them, but by no means is the list exhaustive. Please regard this post for directional reference only, a rough sketch of a large landscape.
1. Healthcare for all – Right to Health
It is only in the last century, after the wars that the world first articulated health as a right. In 1946, as World Health Organization (WHO) was being set up, that its preamble defined health as “a state of complete physical, mental and social well-being and not merely the absence of disease or infirmity”. It further states that “the enjoyment of the highest attainable standard of health is one of the fundamental rights of every human being without distinction of race, religion, political belief, economic or social condition.”
Perhaps here, to get into it deeper, the key aspects of good health contain freedoms, entitlements and factors like available, accessible, acceptable and good quality healthcare, but most important of all, a wide range of factors that allow for a healthy life, including:
- Safe drinking water and adequate sanitation;
- Safe food;
- Adequate nutrition and housing;
- Healthy working and environmental conditions;
- Health-related education and information;
- Gender equality
More here.
Some of these factors have been translated into Sustainable Development Goals for the world. In fact, most of the following goals promote well being and good health of the population. We are though still quite far from achieving them. 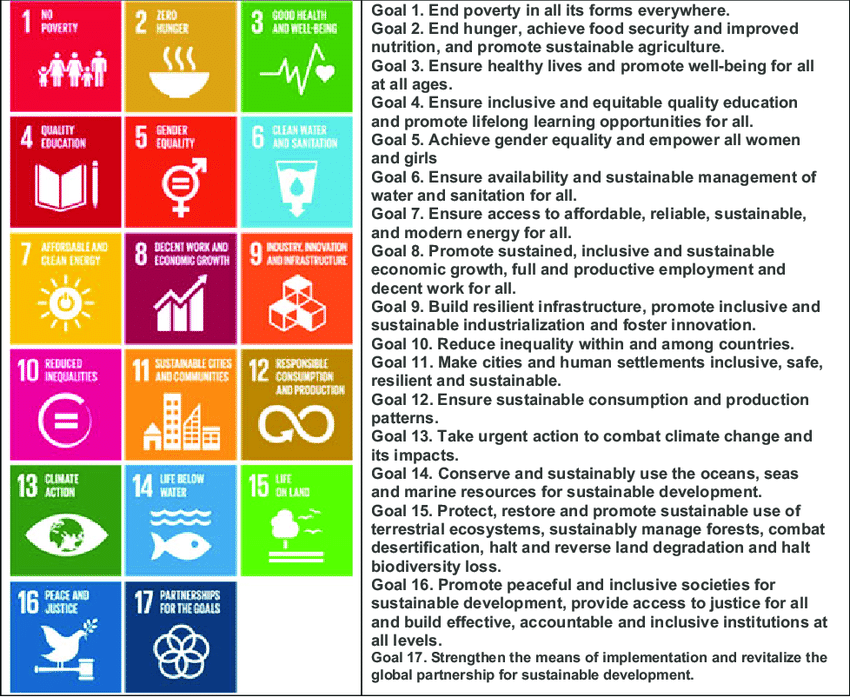
2. World Population – A perspective
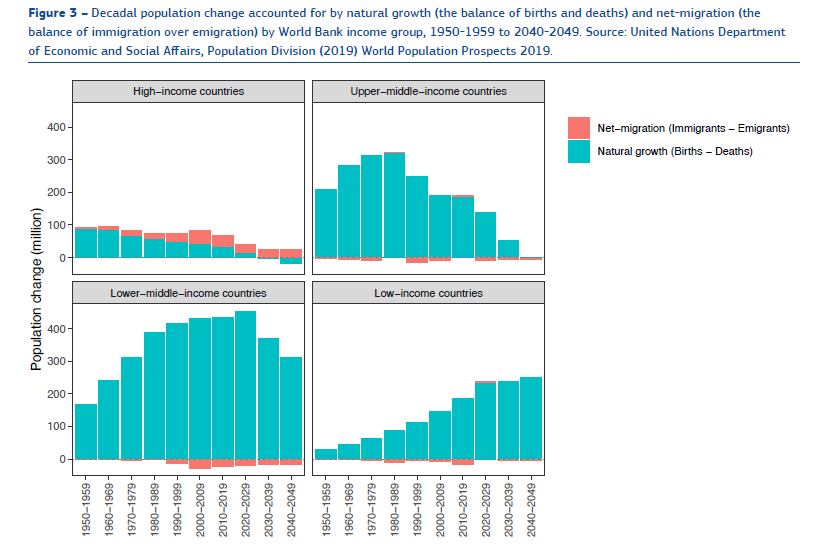
By some counts, world population is 8.3 billion people as of 2026. What perhaps is staggering is that this population was ~2.3 billion in 1946 when the above mentioned WHO preamble was drawn up. Any proactive policy making recognises this change and that this growth is to continue for the next 30 to 40 years, albeit it slows down in many regions.The human world is expected to add another 2 billion people by 2050.
The world presents a mixed bag, there are ageing societies, there are societies with population decline, and then there is Sub-Saharan Africa, where population may triple or quadruple before this century ends. “The geographic centre of the global population will shift towards Africa and Southern and Western Asia and away from major political powers today.” (from here)
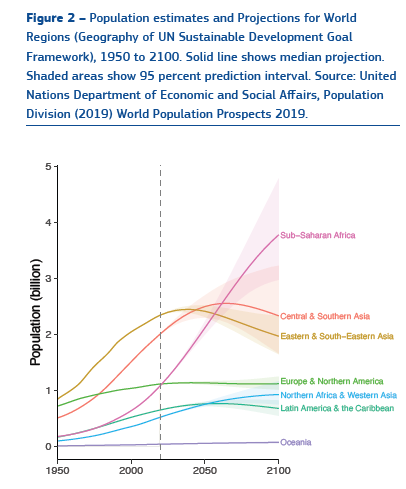
The world changes even as we speak. Affecting this population dynamics with impact on healthcare are the facts of a) rapid growth of population b) ageing of the population c) urbanisation and d) migration
Especially in low-income countries, where there is expected to be rapid population growth, the already difficult sustainable development goals become more challenging.
As to ageing, consider the following chart, from here:
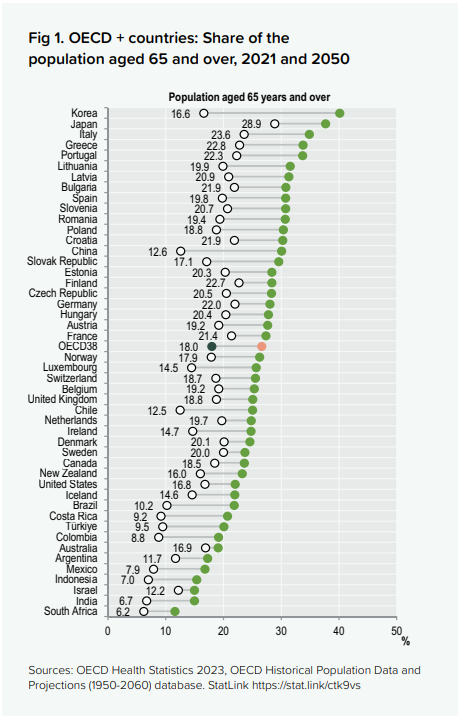
An ageing world requires care in a different way than a young and healthy world. Active healthcare, and not just preventive healthcare becomes a more frequent question as the age dynamics shift to older people. To improve the quality of the last decades of life, a lot of people are needed to care for the elderly, not just treating acute illness.
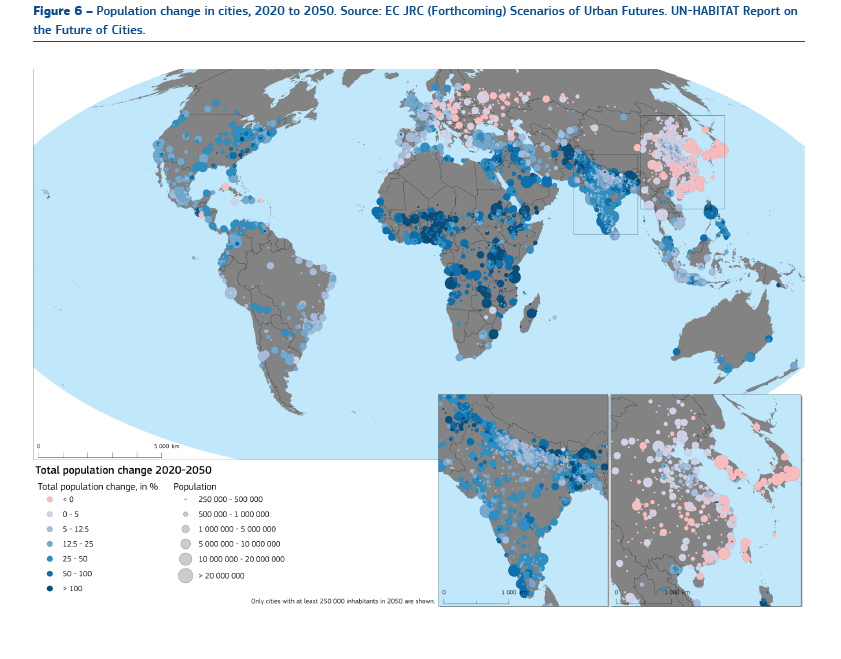
Urbanisation – The fact is the rapidity of urbanisation which affects the resources available to provide those sustainable development goals. In 1946, city living was unusual. Less than 30% of the population was urban, or less than 1 billion people lived in cities. In 2007, around half the world or 3.3 billion people were living in urban areas. It is expected that by 2050, 6.5 billion people will live in urban centres – over two-thirds of the projected world population.
It is the change and growth which require a supporting level of change and growth in the services provided to the population as well. Philosophically, we are at a historic transition point, where the last transition period was when hunter-gatherers settled down in villages and lived so for centuries. And then the last 70-80 years and the coming 20 -30 years, where it is predicted that 86% of the developed world, and 64% of Asia and Africa will be living in urban regions.
The other aspect affecting the population is migration. Growth, if any, in the developed world is expected to come from in a large proportion through net migration to the countries.
All these factors affect the healthcare goals as well.
3. Global Burden of Diseases
A look at what ails people:
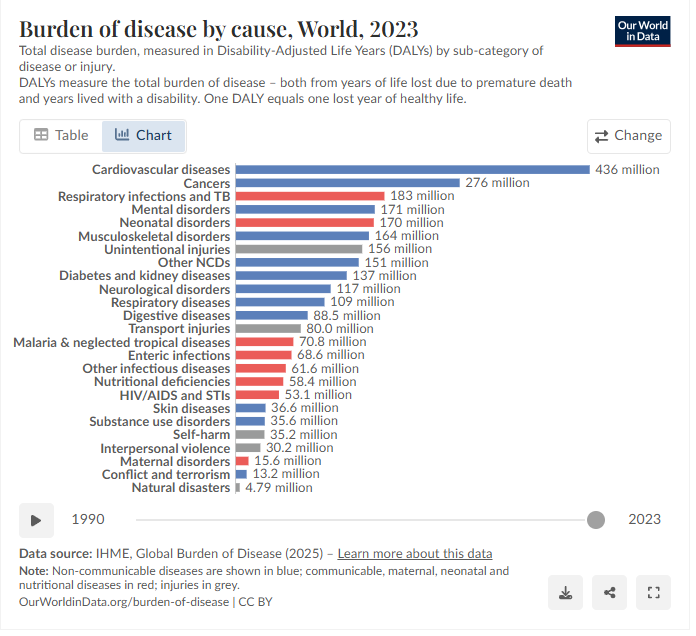
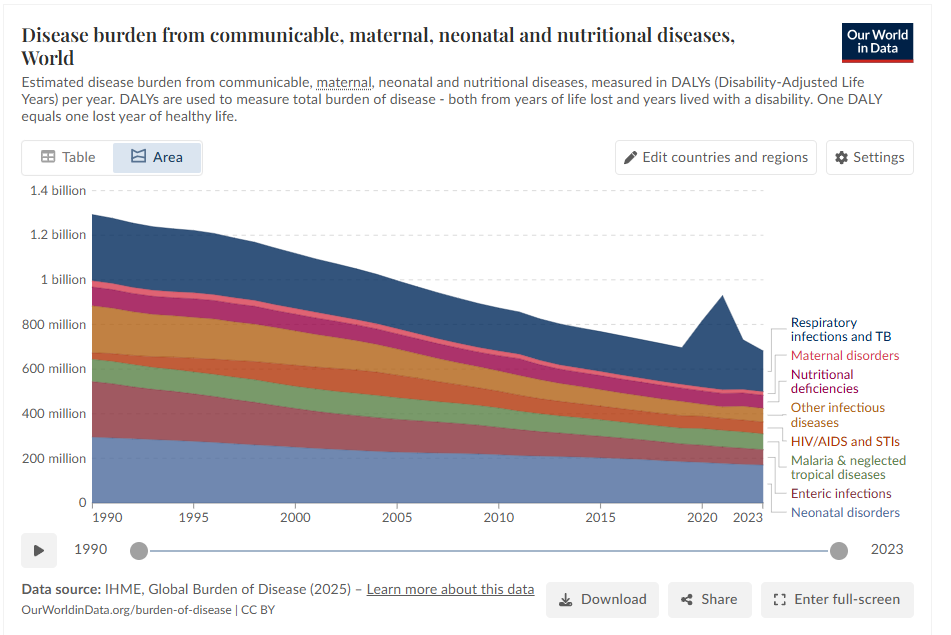
“At a global level, the largest disease burden comes from cardiovascular diseases. This is followed by cancers, neonatal disorders, musculoskeletal disorders, respiratory infections, and mental and substance use disorders. In low-income countries, communicable and neonatal diseases tend to rank much higher. This starkly contrasts with high-income countries, where communicable diseases may not be in the top ten, and instead, cardiovascular disease and cancers tend to contribute the largest burden.”
Disease burden is measured in DALYs. “DALYs (Disability-Adjusted Life Years): combines years lost to premature death + years lived with disability. QALYs (Quality-Adjusted Life Years): measures years of healthy life gained or lost. These metrics allow comparison of very different diseases (e.g., malaria vs. depression vs. diabetes) on a common scale.”
In high income countries, a large part of global disease burden is linked to lifestyle and environment. In low income countries, communicable and neonatal diseases are preventable to an extent with right actions and policies.
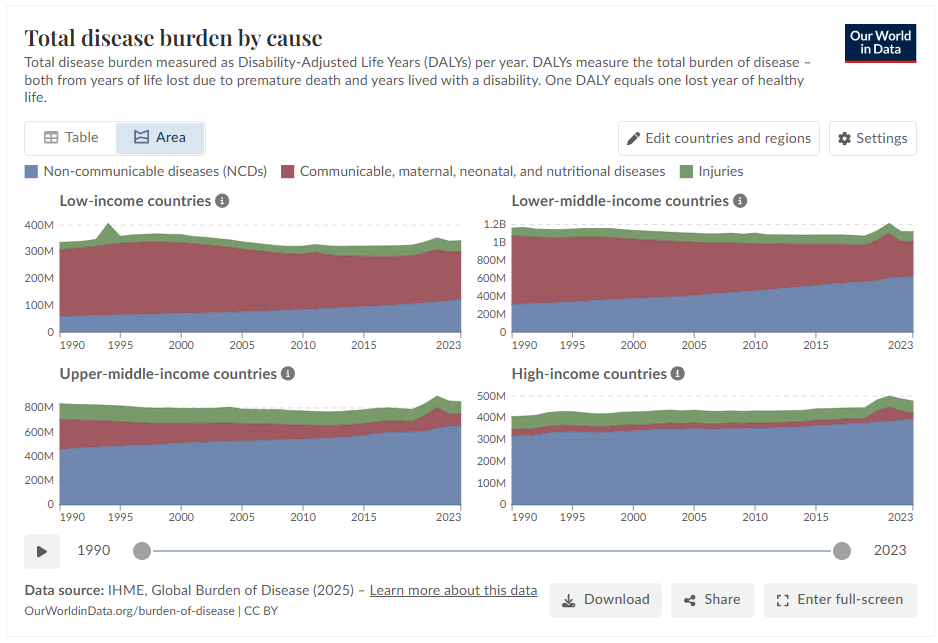
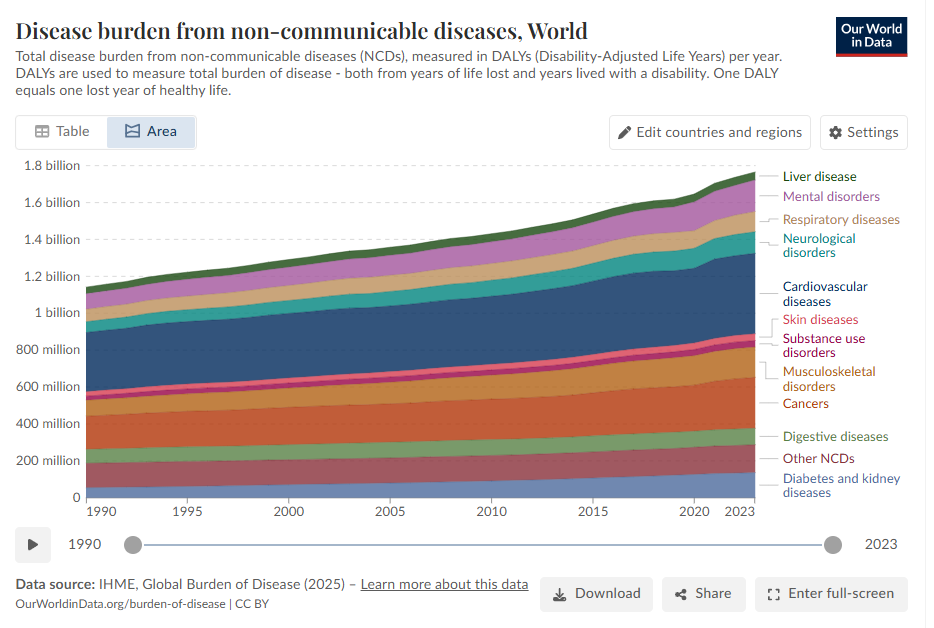
Also, consider these two illuminating charts on disease burden from non-communicable diseases and from communicable + maternal, neonatal diseases globally.
To further consider these diseases burden, lets take a look at cause of death globally. Some diseases people live with, and they add to the DALYs, but there are some diseases that people die of.
Consider the following chart against the fact that around 140 million babies are born in the world every year and around ~53-63 million people die every year.
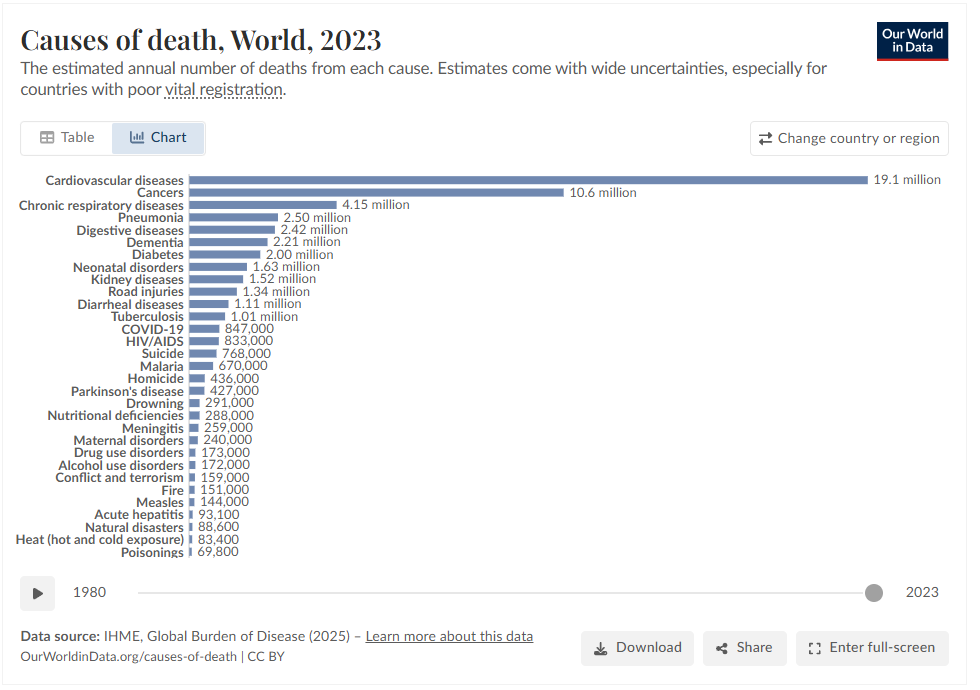
The above chart is a snapshot of 2023, a global picture. But the world over, healthcare is not the same. Consider the following chart on Cardiovascular diseases and the vast differences globally.
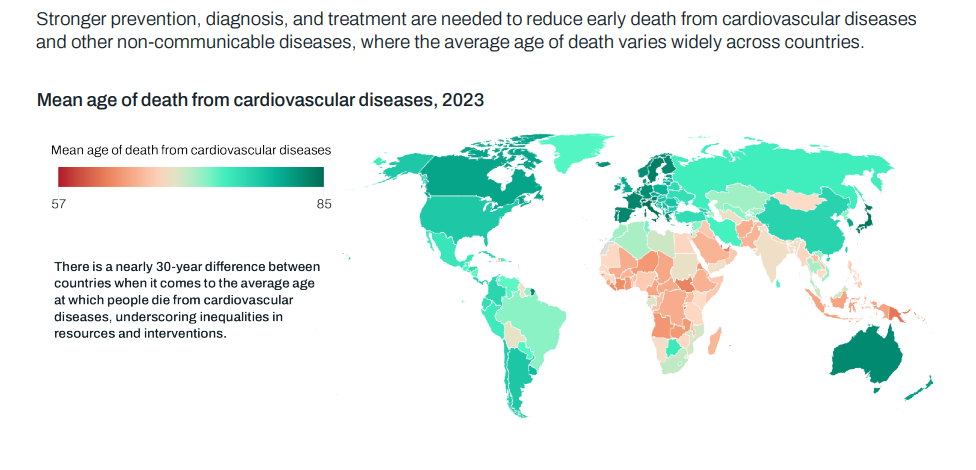
(from here)
A set of stark facts:
“The number of people living with diabetes rose from 200 million in 1990 to 830 million in 2022. Prevalence has been rising more rapidly in low- and middle-income countries than in high-income countries.”
Cancer is a leading cause of death worldwide, accounting for nearly 10 million deaths in 2020, or nearly one in six deaths. The most common cancers are breast, lung, colon and rectum and prostate cancers. Around one-third of deaths from cancer are due to tobacco use, high body mass index, alcohol consumption, low fruit and vegetable intake, and lack of physical activity. In addition, air pollution is an important risk factor for lung cancer.
Global life expectancy increased by 6.2 years since 1990, largely thanks to: lower mortality rates for diarrhea and lower respiratory infections, lower mortality rates in ages over 55 for stroke, cancers, and ischemic heart disease.
High blood pressure, smoking, high blood sugar, and ambient particulate matter air pollution are among the leading risk factors globally and at each level of the Socio-demographic Index. Policy interventions to date have been insufficient to address rising exposure to risk factors including high body mass index, high blood sugar, ambient air pollution, drug use, and high temperatures. Countries have made rapid progress in reducing exposure to childhood and maternal malnutrition, household air pollution, and unsafe water, sanitation, and handwashing.
Another stark fact:
Some 1 million people are estimated to die each year from diarrhoea as a result of unsafe drinking-water, sanitation and hand hygiene. Yet diarrhoea is largely preventable, and the deaths of 395 000 children aged under 5 years could be avoided each year if these risk factors were addressed.
Consider that 2.2 billion people live without safely managed water services (1.5 billion live within 30 mins of improved water source, 292 billion beyond 30 mins, but ~400 million collect water from unprotected wells or untreated surfaces)
Yet another stark fact:
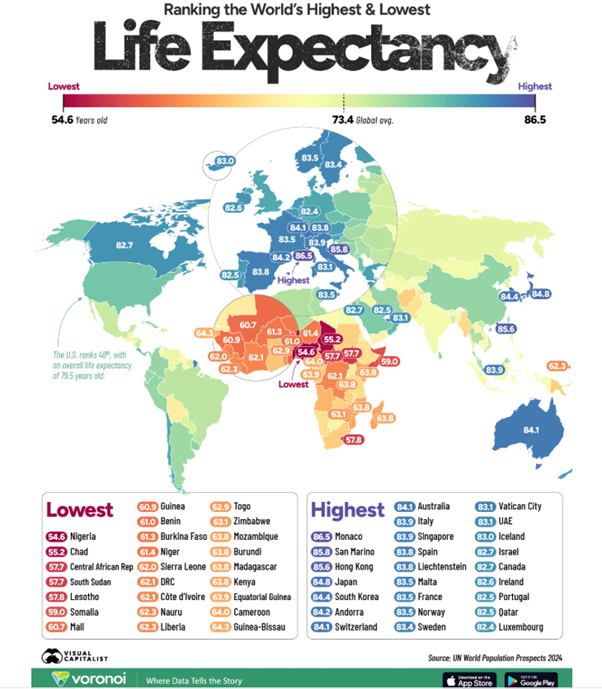
Inequalities in health persist in the world. There is still lack of basic healthcare access. Globally, an estimated 260,000 women died during pregnancy and childbirth in 2023. And 344 million people were pushed or further pushed into extreme poverty in 2019 due to out-of-pocket payments for health.
Consider this against the global life expectancy as shown in following chart:
4. Primary Health Care
Declaration of Alma-Ata, 1978 – The Declaration affirms the crucial role of primary health care, which addresses the main health problems in the community, providing promotive, preventive, curative and rehabilitative services accordingly (art. VII). It stresses that access to primary health care is the key to attaining a level of health that will permit all individuals to lead a socially and economically productive life (art. V) and to contributing to the realization of the highest attainable standard of health.
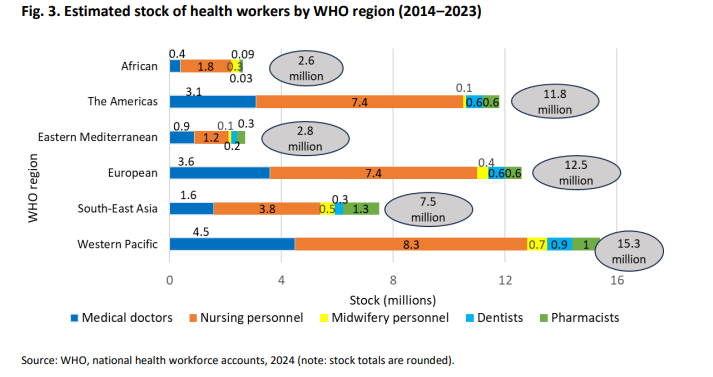
Healthcare is labor intensive. There are around 12.7 million doctors globally. And 65 million total health workforce. What is perhaps worth noting here is that 22% of the world’s population has access to nearly half the health professionals.
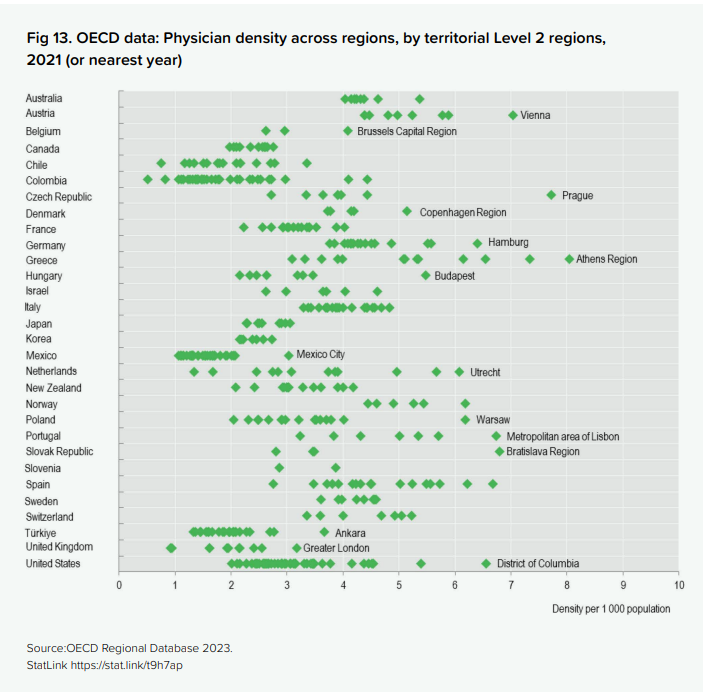
To get a better sense of how basic healthcare is available across countries, consider this set of charts. (Note the workforce proportion in Nordic regions engaged in healthcare)
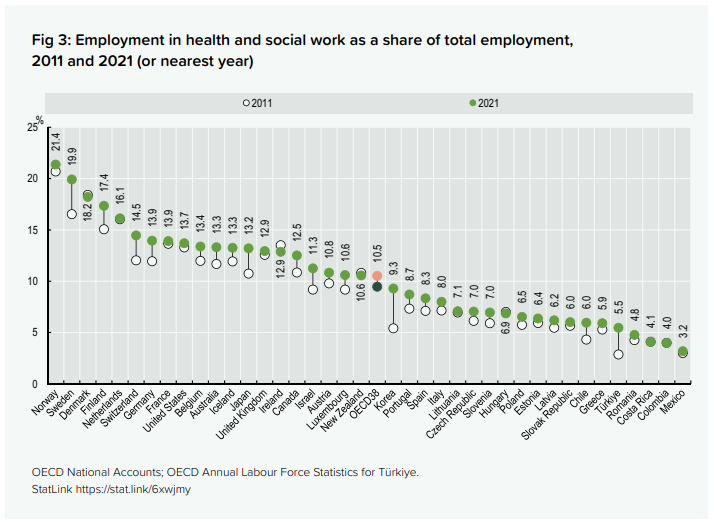
The WHO benchmark is 2.5 total medical staff per 1,000 people — the minimum considered adequate for primary care coverage. The OECD average for doctors alone sits at 3–4. Against that: the US has 2.6 physicians per 1,000, Germany ~4.5, Australia ~3.8, UK ~3, China ~2, India ~0.7.
Following is based on data from Worldbank and some AI help to create the following two charts. Two charts, read side by side, make the point more sharply than any summary can.The first chart shows doctors (dark blue) and nurses (light blue) per 1,000 people; the second shows hospital beds (brown). Across the world’s richest countries, poorest countries and the most populous countries.
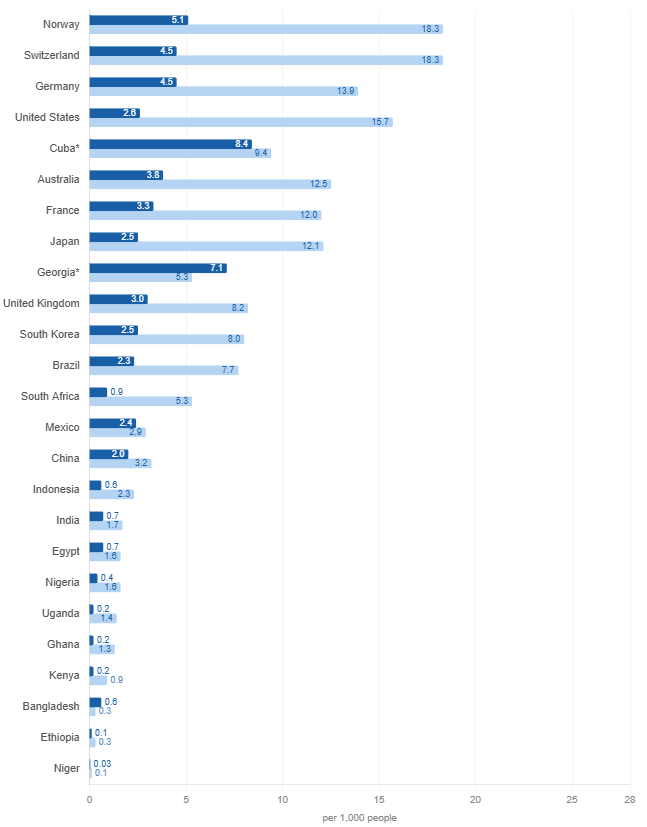
Source: WHO Global Health Workforce Statistics via World Bank (most recent year available, 2018–2022). *Cuba and Georgia are notable outliers for their income level. 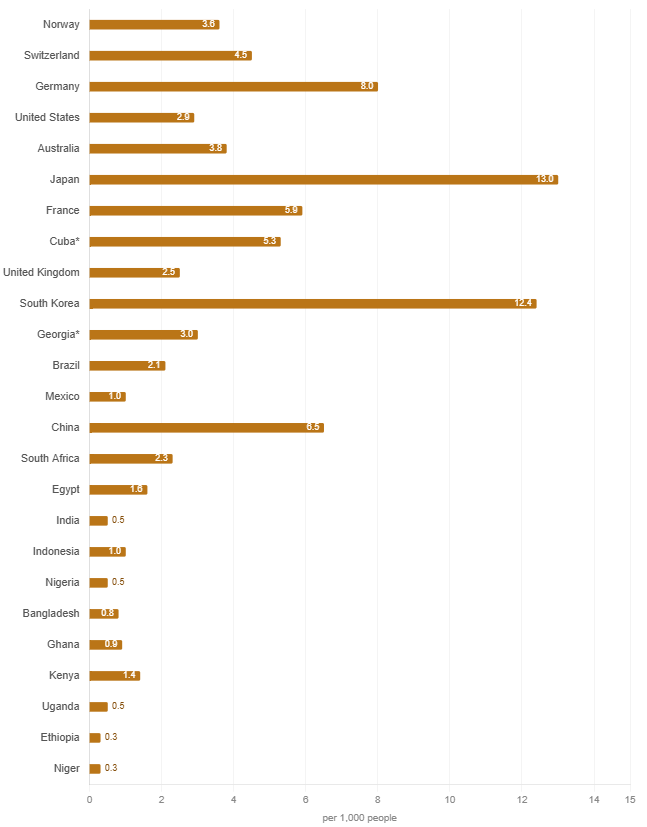
Source: WHO / World Bank (most recent year available per country, 2010–2020; beds data is reported less frequently than workforce data). *Cuba and Georgia are notable outliers for their income level.
Rich countries tend to be consistent across both — Germany, Norway, Switzerland score well on staff and reasonably well on beds. The countries at the bottom of both — Niger, Ethiopia, Uganda, Nigeria — are not simply short of staff. They are short of everything: the people who attend births, the people who manage wards, and the physical infrastructure to receive patients at all.
The difference is not just between rich and poor countries. Even in developed countries, the density of doctors is greater in metropolitan/urban regions. From here
Behind every doctor-per-1,000 statistic is a medical education system, universities, faculty, clinical training infrastructure, years of investment. In much of Sub-Saharan Africa and South Asia, that infrastructure is itself underdeveloped relative to the population it needs to serve. And as populations in the global south grow rapidly over the next thirty years, the speed of growth of medical education needs to adjust for the fact. There is a further complication: brain drain. The countries that most need trained medical professionals are also the ones whose graduates are most likely to emigrate.
Thus, the need for more doctors and nurses make medical education a development priority in the same register as clean water, sanitation etc. One of the ways the developing world has tried to stretch the thin system (for example in Brazil and Ethiopia) is by running large scale community health programmes.
5. Health Expenditure and financing
Healthcare differs around the world in significant ways. From some countries providing universal care to others with different payment models. As one of the social & welfare functions of a government, amidst Education, Income Security (pensions, employment), Social Services (housing, childcare), and Labour Market Regulations (minimum wages), Healthcare is one of the fundamental policies of any government.
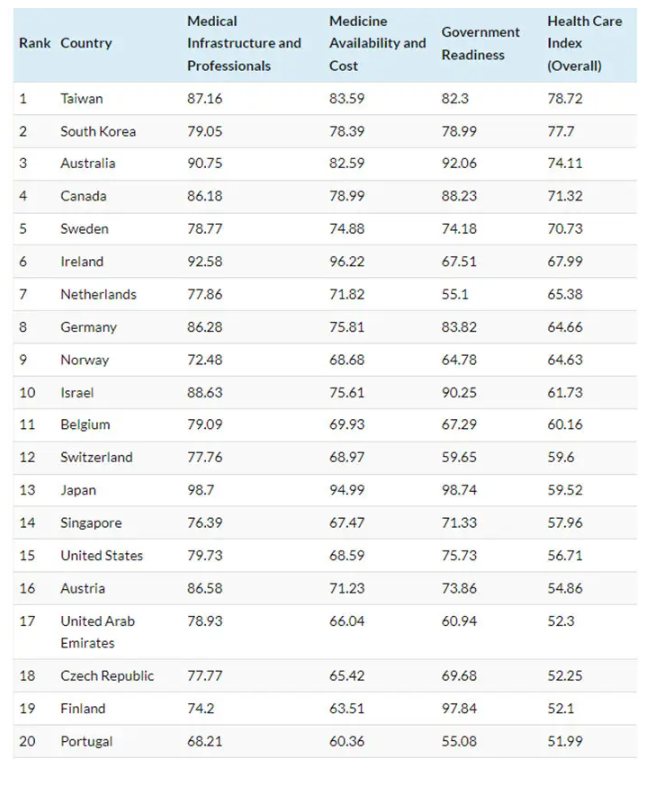
“The quality of healthcare is determined by considering a wide range of factors, including the care process (preventative care measures, safe care, coordinated care, and engagement and patient preferences), access (affordability and timeliness), administrative efficiency, equity, and healthcare outcomes (population health, mortality amenable to healthcare, and disease-specific health outcomes).”
A look at how countries spend on healthcare – health expenditure as a share of GDP
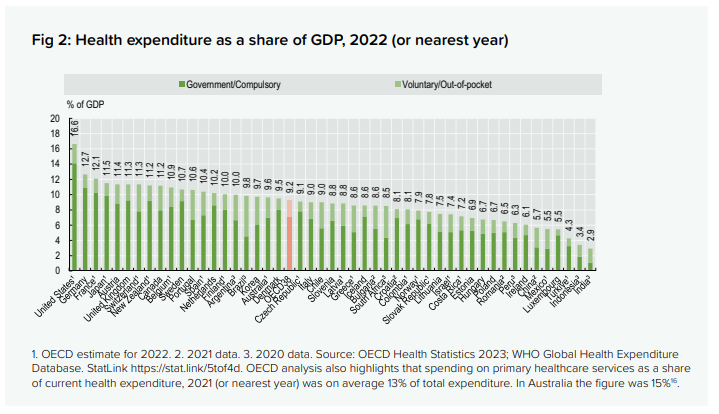
From here.
Global healthcare spending is projected to grow from an estimated $11.2 trillion in early 2026 to $20.5 trillion by 2050.
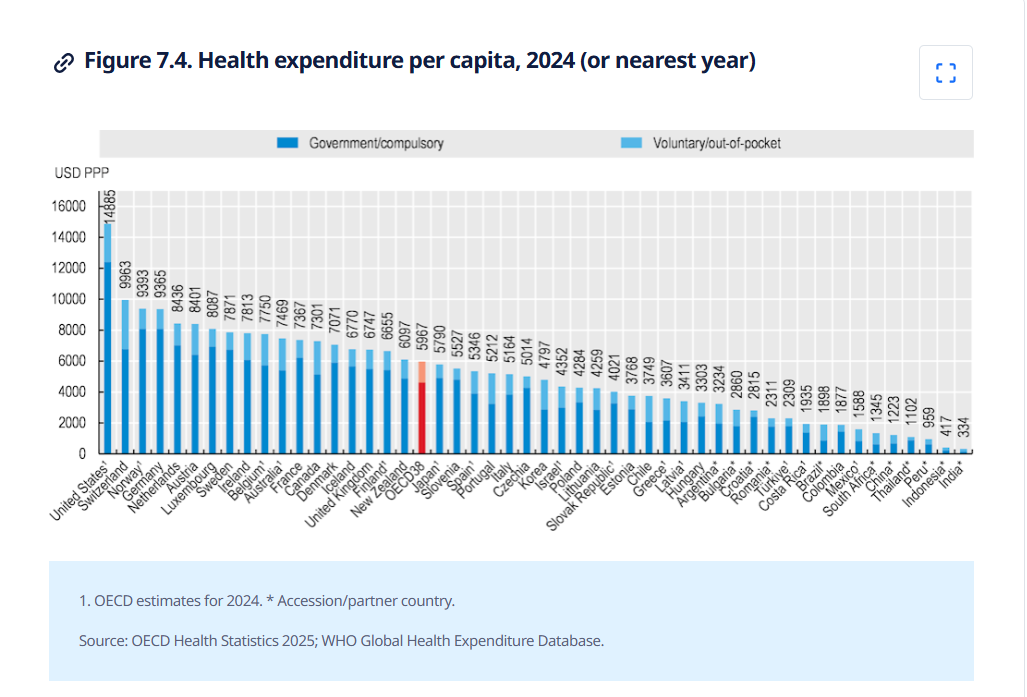
Another way to consider it is to see the stark difference in expenditure depending on the income level of the country.
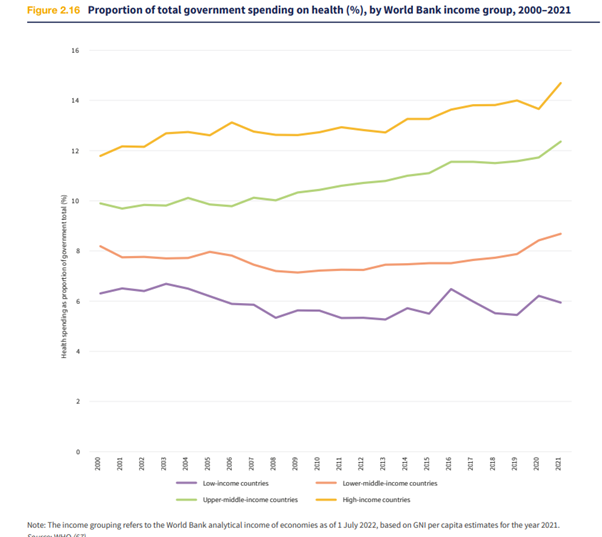
This makes the gap very wide between the poor people of the world and the rich people of the world – in terms of how much their government spends on healthcare. Especially since the GDP itself is very low in the less rich countries, the proportionate spend on healthcare is magnitudes apart.
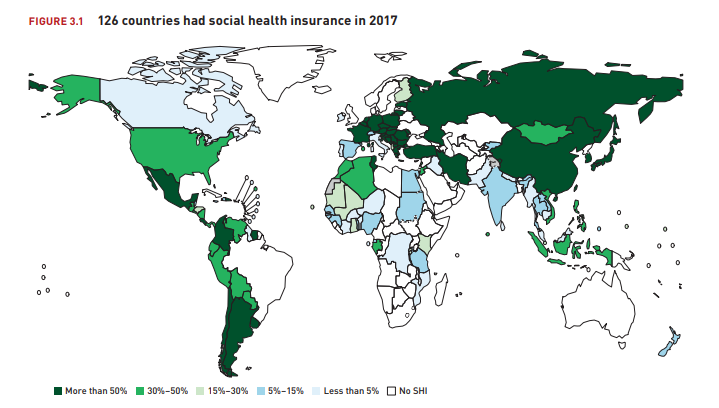
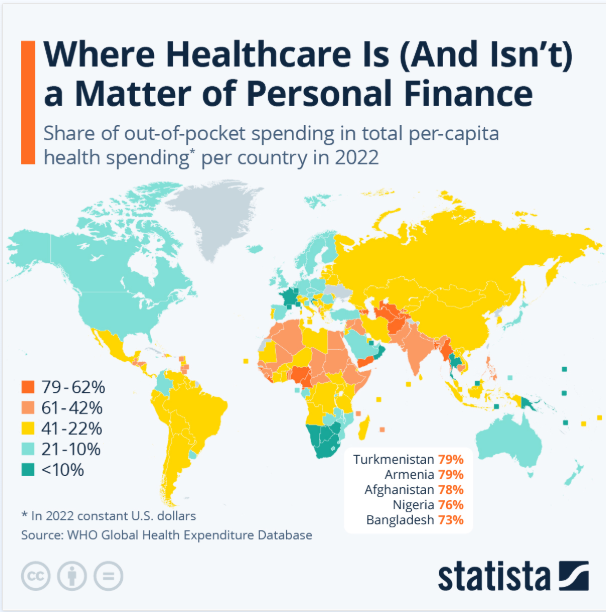
The world is not the same in how that health is funded. How the world pays for health changes from country to country. “Billions of people living in countries where out-of-pocket spending is at least 50% of current health spending.”
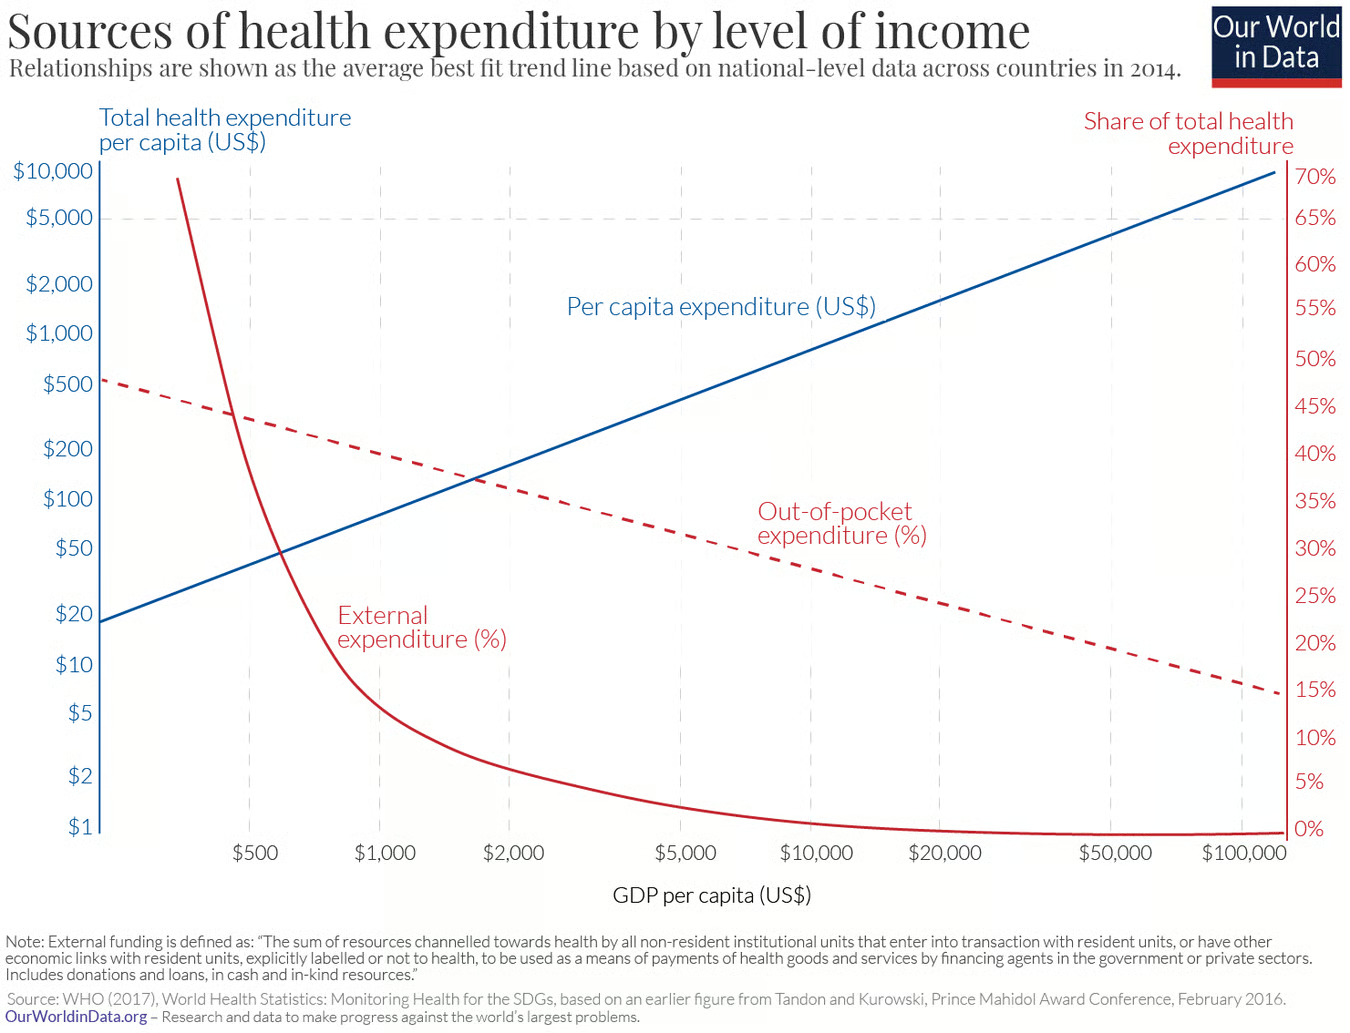
“In countries where healthcare is principally financed through public funds, out-of-pocket spending is typically low; this is natural since in these countries there is essentially universal coverage through public insurance (e.g. Cuba, UK, Sweden, France). By the same logic, out-of-pocket spending is also low in countries where healthcare is largely financed through private funds in the form of private voluntary insurance (e.g. US). It is in countries with low public healthcare spending and low private voluntary insurance that out-of-pocket expenditure is high (e.g. India, Afghanistan, Sudan).”
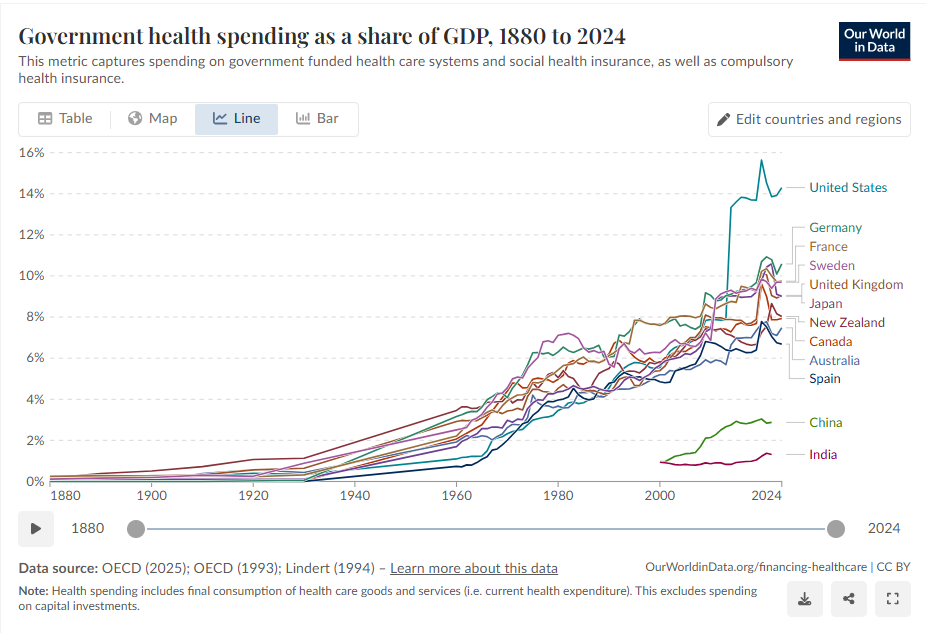
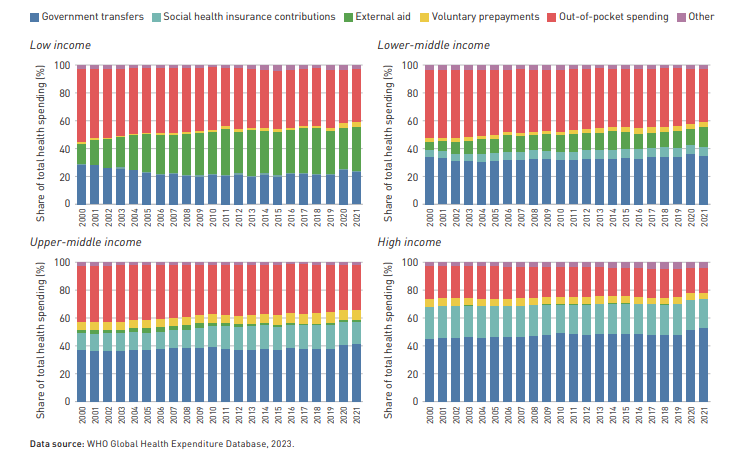
Trends in Health Expenditure by Income group (from here)
Before these scientific developments took place, the main component of healthcare was not treatment but income insurance, insurance paying benefits to those who were unable to work due to poor health. In fact, public health insurance for workers was already substantial in a number of European countries before the Second World War.
After government schemes, social health insurance and out-of-pocket payments, private health insurance is an important source of health financing in many OECD countries. On average, it finances one in every ten USD spent on health across the OECD, but this average masks considerable cross-country variation. Private health insurance accounts for a third of all health spending in the United States, nearly half in Switzerland and around 60% in the Netherlands (Figure 1). On the other hand, in around half of OECD countries it accounts for 5% or less of health spending and plays an almost negligible role in the Czech Republic, Estonia and Sweden. (from here)
Here’s a look at health insurance in Asia.
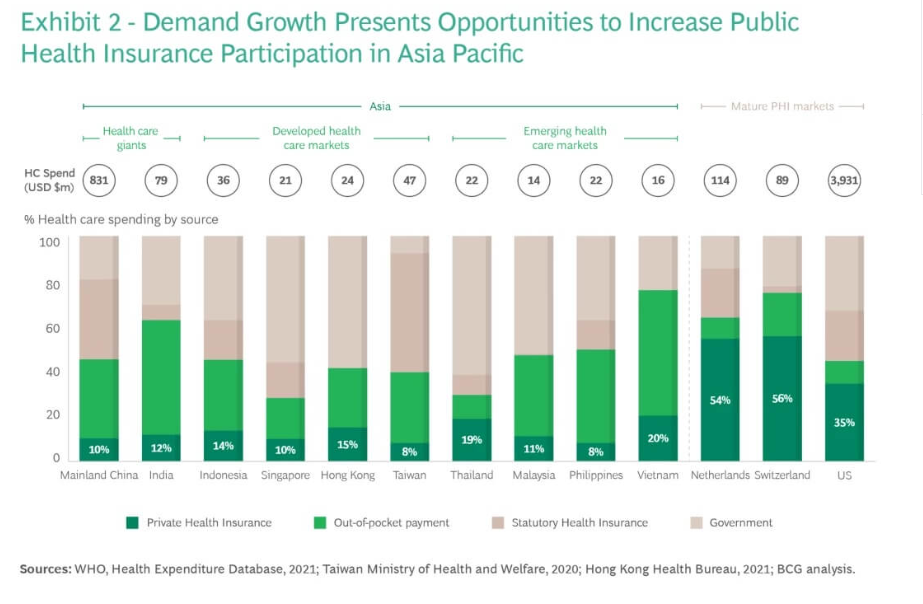
This set of charts is to be absorbed and kept at the back of mind as one reads the rest of this post. One of the things that comes up from these charts – that healthcare financing is a development story, not just a health policy story. As countries get richer, total spend rises, government takes over more of the burden, and individuals bear less personal risk. While in low income countries, there is high personal exposure, and low total spend.
6. Healthcare Models
Global healthcare is a mixed landscape striving towards Universal Health Coverage (UHC), with 4.6 billion people still not fully covered as of 2023. While high-income nations provide near-universal access, roughly 2 billion people face financial hardship due to out-of-pocket costs, primarily in low-income regions. Top-performing systems are found in Singapore, Japan, and Western Europe.
There are ~200 countries in the world. According to one source, there are only 40 countries with some proper healthcare model.
Apart from the out-of-pocket model where the patient bears the treatment cost, there have been these other healthcare models. Where the countries have followed Beveridge system, Healthcare is a public service, funded through general taxation. The government owns most hospitals and employs most doctors. Care is free at the point of use, there are no insurance premiums or medical bills for most services. On the other hand, if the country follows Bismarck model, healthcare is financed jointly by employers and employees through payroll deductions into non-profit “sickness funds.” Insurers must accept all applicants and cannot profit. Doctors and hospitals are mostly private. While in National Health Insurance model, a hybrid of Beveridge and Bismarck: private-sector providers deliver care, but a single government-run insurer pays the bills. All citizens pay into the fund via premiums or taxes. The US, the biggest health market in the world is a hodge-podge mix of several systems with poor outcomes.
Following chart summarises them:
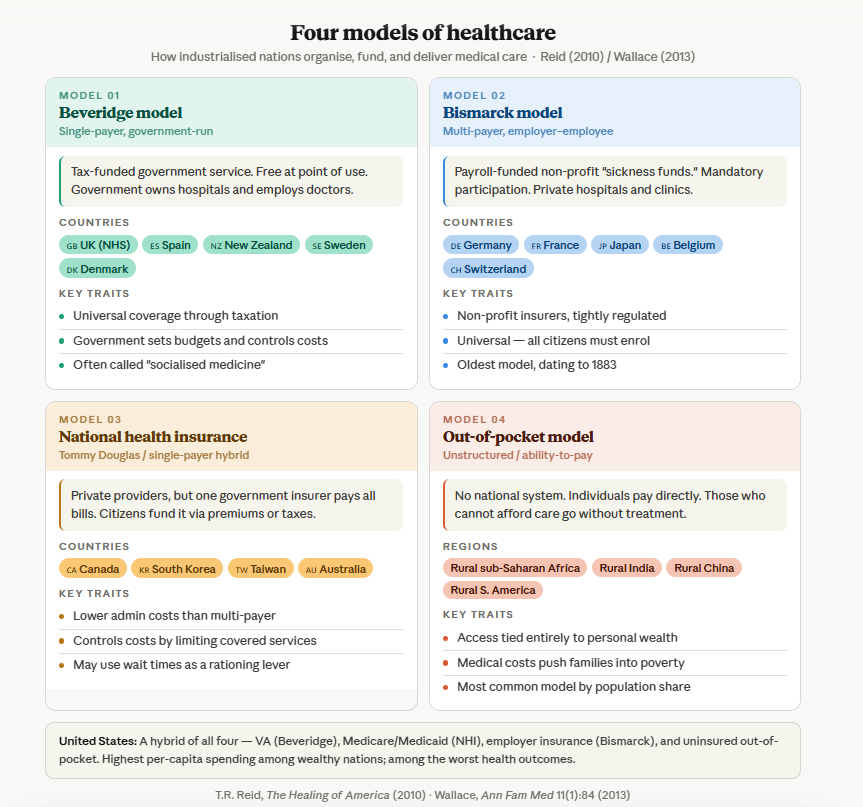
A comparison of healthcare models around the world:
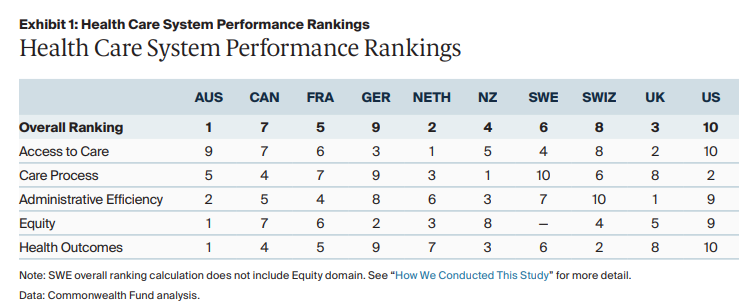
From here. A further extract from the report talking about how the US healthcare system can be imporved is appended to this post.
Any new country evolving their healthcare system will perhaps do well to look at best practices across all systems. There’s perhaps no perfect model. And yet, if there were to be one, according to this source, it might look like the following: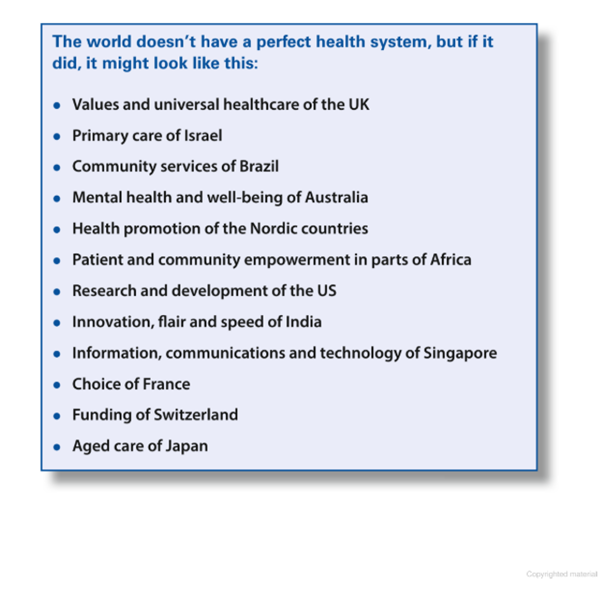
7. Public Health
Public Health is different from Healthcare function of the government. Where healthcare is individual focused on managing of illness once it has arisen, public health governs the general environment, is population focused. It is delivered through sanitation, vaccination programs, regulation, education. And now, given the rise of disease burden of lifestyle diseases, actions such as tobacco control, labelling, urban design, alcohol policies, screening and early detections and increasingly, behavioral nudges. Although the budgeting is separate, public health is the foundation of a good healthcare system, a wise government would spend more in public health. It is a design and innovation challenge to shape the environment of choice.
“The science and art of preventing disease, prolonging life, and promoting health through the organized efforts and informed choices of society, organizations, public and private communities, and individuals.”
—CEA Winslow
Prevention is the cornerstone of Public Health. Prevention can be primary, secondary, tertiary.
Primary prevention is concerned with eliminating risk factors for a disease. Secondary prevention focuses on early detection and treatment of disease (subclinical and clinical). Tertiary prevention attempts to eliminate or moderate disability associated with advanced disease.
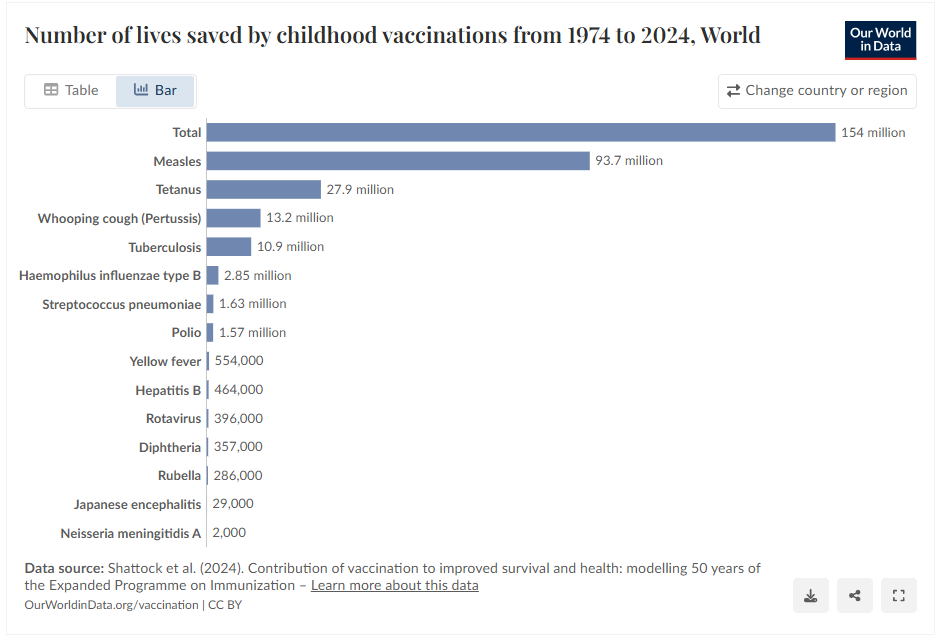
Apart from other policies which ensure access to clean water and sanitation, access to safe food and nutrition, access to clean cooking fuel, healthy work environment, basic education, gender equality etc, one of the biggest impact activities is immunisation of the population.
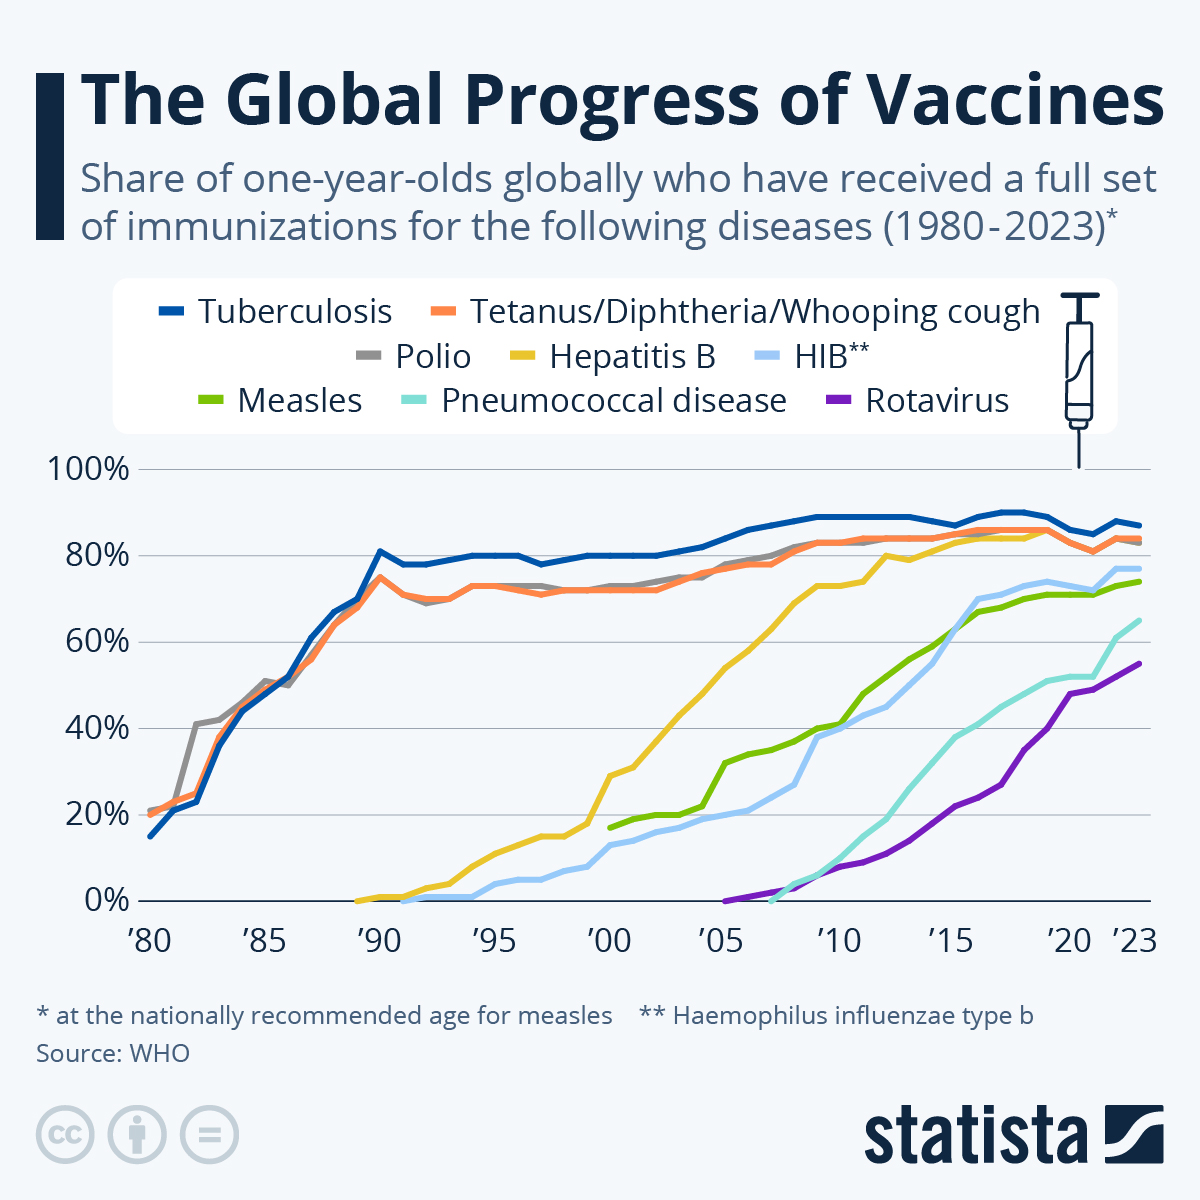
Global vaccine coverage made strides in the past 40 years before stagnating, as very common vaccines struggled to go the “last mile” of reaching all children, including those in unstable countries and war zones. Growing vaccine skepticism – including in developed countries – is posing another challenge.
In 1980, only around 20 % of children in the world had received the vaccines for tuberculosis, DTP (diphtheria/tetanus/whooping cough) and polio. While the former two were developed in the 1920s, the polio vaccine became commercially available in 1961. Coverage rates for the three diseases rose to approximately 80 percent in the ten years up until 1990.
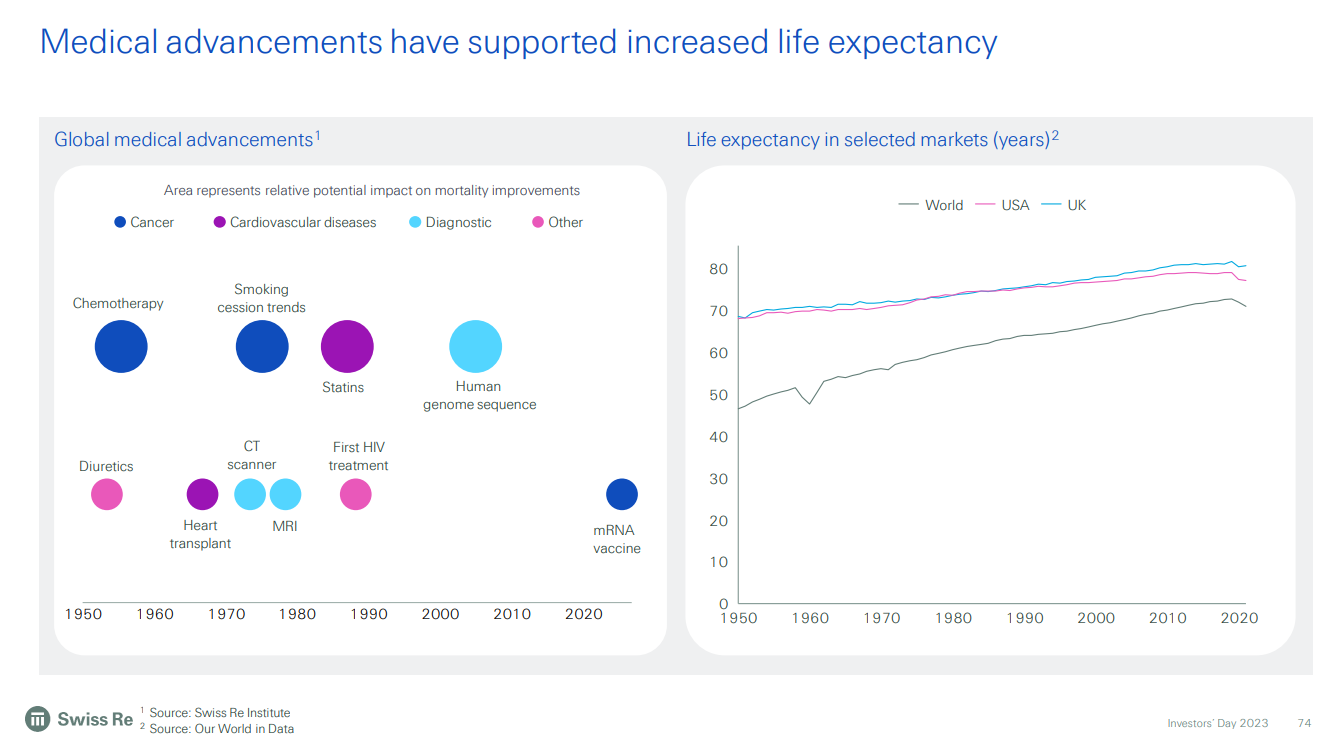
8. Development of treatments
In terms of history of development of treatments over the last 70-80 years, here is a chart from SwissRe investor presentation talking about medical advancements – recent past.
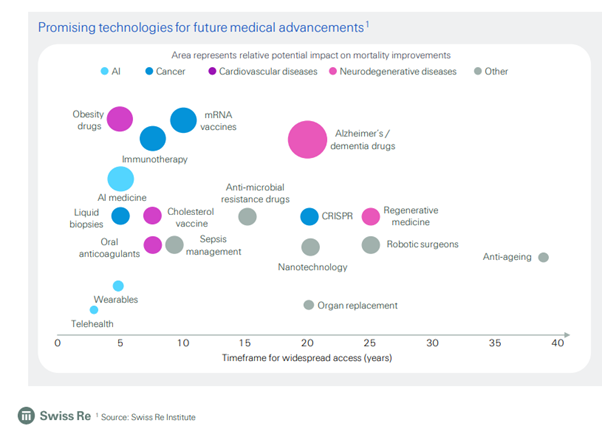
Here’s another of their charts talking about expected advancements in the near future.
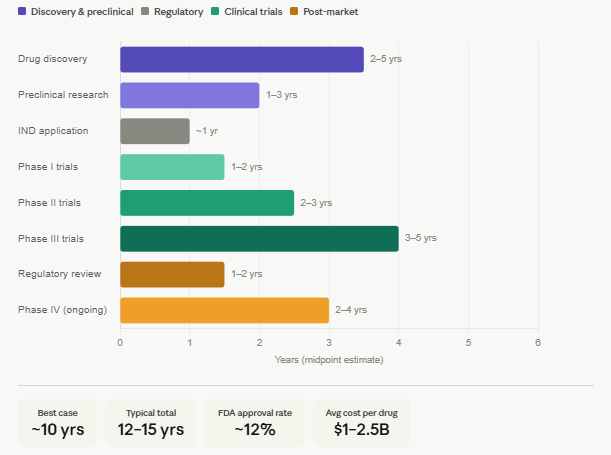
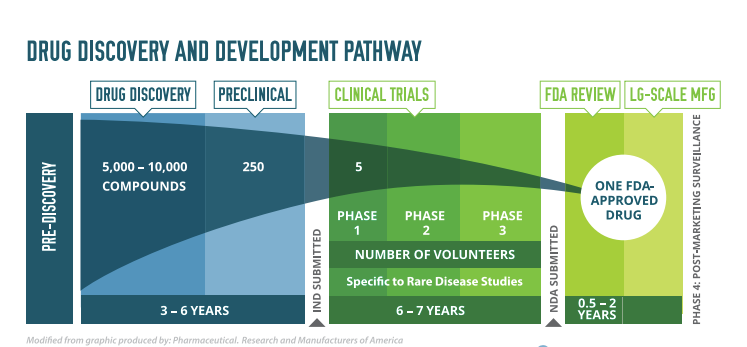
It takes time to develop treatments. If everything goes smoothly, 10-15 years. And meanwhile the costs also add up. Here’s an infographic showing the phases of development and the time taken:
1. Drug Discovery — 2–5 years Identifying a disease target, screening thousands of compounds, and selecting a promising candidate.
2. Preclinical Research — 1–3 years Lab and animal testing to assess safety, toxicity, and biological activity before human trials.
3. IND Application — ~1 year Submitting an Investigational New Drug application to regulators (e.g. FDA) and awaiting approval to begin human trials.
4. Clinical Trials — 6–10 years This is the longest and most expensive phase:
- Phase I (1–2 years): Safety testing in a small group (~20–100 healthy volunteers)
- Phase II (2–3 years): Efficacy and side effects in a larger group (~100–500 patients)
- Phase III (3–5 years): Large-scale trials (~1,000–5,000+ patients) to confirm effectiveness and monitor adverse reactions
5. Regulatory Review (NDA/BLA) — 1–2 years The full data package is submitted to regulators for approval. Standard review takes ~12 months; priority review can be ~6 months.
6. Post-Market Surveillance (Phase IV) — Ongoing Monitoring the drug in the general population after launch.
In 2025, the U.S. Food and Drug Administration (FDA) approved 44 new drugs, reflecting a slight decrease compared to previous years but maintaining the overall trends in pharmaceutical innovation.
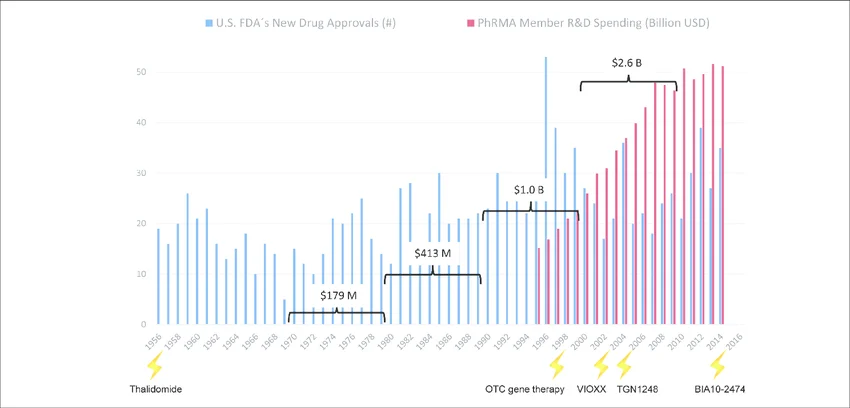
Changes in drug development over the last seventy years. Number of drugs approved by the US FDA (FDA, 2013; FDA, 2014a) are plotted against the pharmaceutical research and development spending of the members of the Pharmaceutical Research and Manufacturers of America (PhRMA, 2015). Drug or substance failures with detrimental outcome for humans (lightening) (see Tab. 1) and average costs to develop one new drug including costs of failures within the corresponding decade (brackets) are given.
Over 10,000 drugs are under development at the moment.
Top Disease Areas in 2026 Drug DevelopmentBased on reports of R&D activity (as of mid-2025/early 2026):
- Immunology: 1,469 drugs in the pipeline.
- Dermatology: 1,327 drugs in the pipeline.
- Sensory Systems: 1,312 drugs in the pipeline.
- Cardiology: 1,207 drugs in the pipeline.
- Oncology: Over 2,000 clinical trials were evaluating new treatments across 120 indications, driven by ADC dominance and Immuno-Oncology (IO) optimization
More notes can be found here.
More notes here.
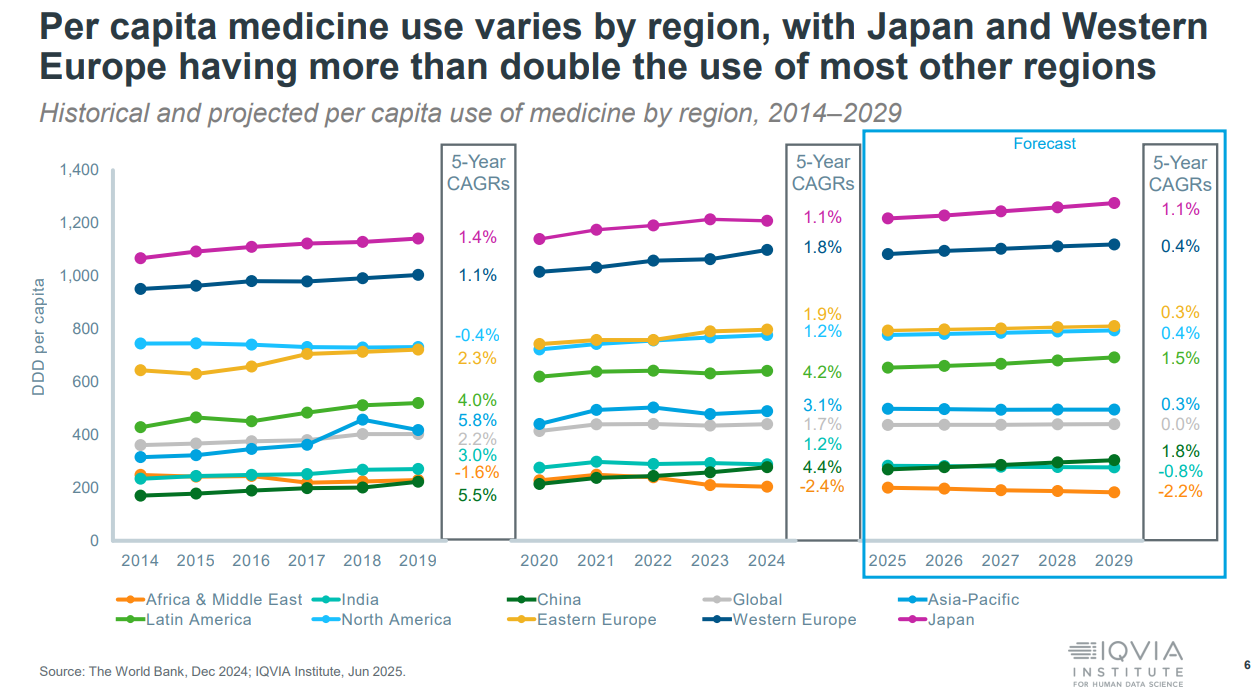
9. Healthcare Market
The global healthcare market is close to $9 trillion by different estimates.
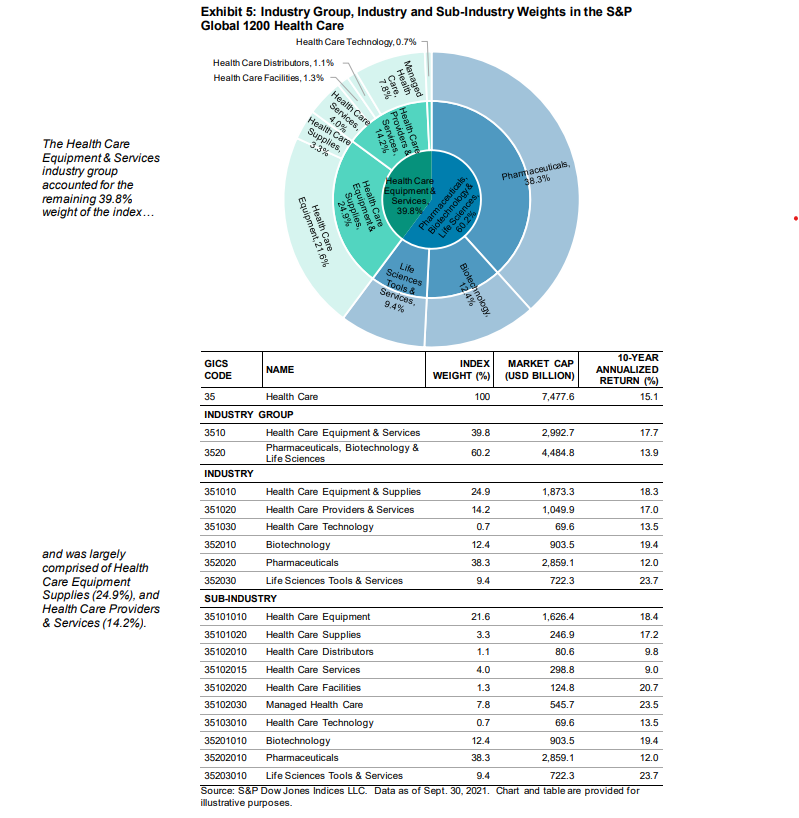
Of this, the public markets are $7.5 trillion. (from here)
Perhaps here, before we explore the listed pharmaceuticals space, to understand Patents. Because Drug R&D is expensive, pharma companies look to recoup their costs during the patent period of the drugs. A drug patent usually lasts 20 years from the date of filing (during discovery or preclinical phase).
Given that developing a drug costs $1–2.5B and takes 12–15 years, and that only ~12% of candidates succeed, companies are essentially pricing not just for one drug’s development cost, but to cross-subsidise the many failed attempts that never made it to market. The patent exclusivity window is the only mechanism the system provides to make that math work
By volume, globally, generics (off patent drugs) are 80% of the market. But by value, branded prescription drugs form 87% of the market. Most of these are in the US. China and India having the highest volume of generic drug sale hence in dollar terms the market is not comparable to US.
Global Pharma sector is USD 1.7-1.8 trillion by some counts, higher by some other counts. Half of global pharma revenue comes from the US, with around 4% of world population.
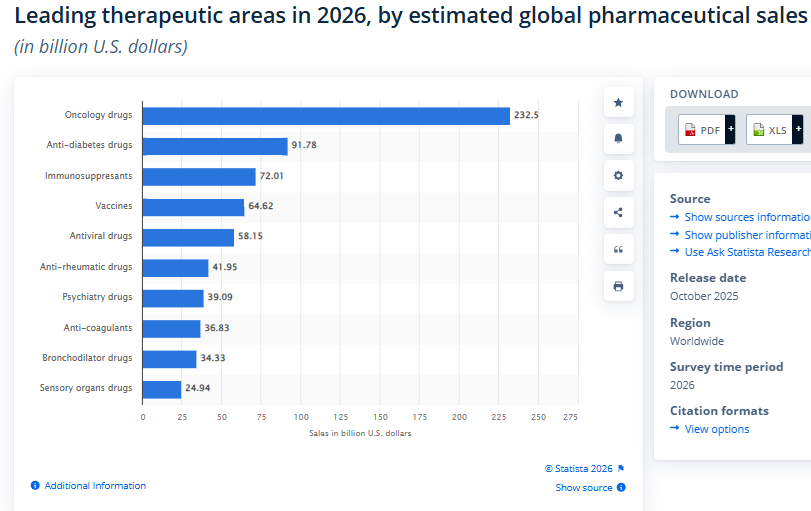
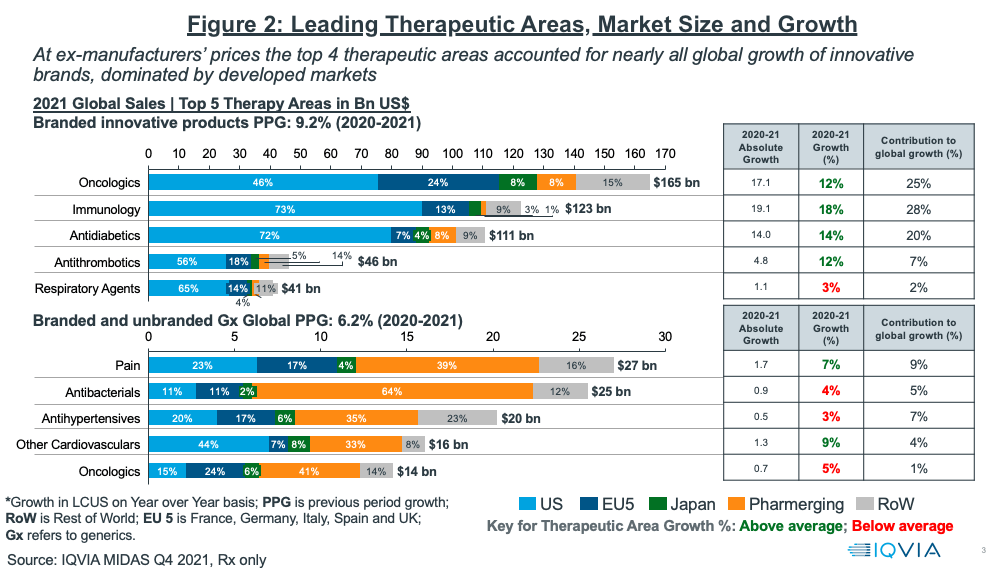
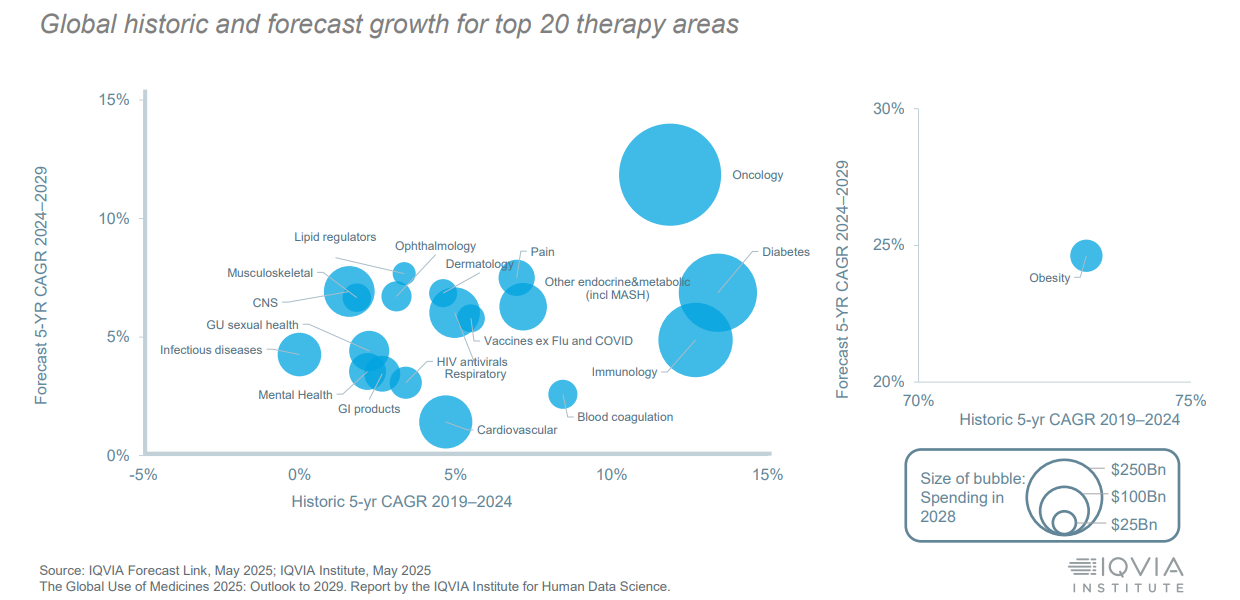
Even within the diseases that score heavily on DALYs — cardiovascular disease is the world’s largest burden, diabetes has tripled in three decades — the pipeline skews toward oncology, because the pricing power and IP protection in cancer treatment exceeds what cardiovascular or metabolic drugs can command.
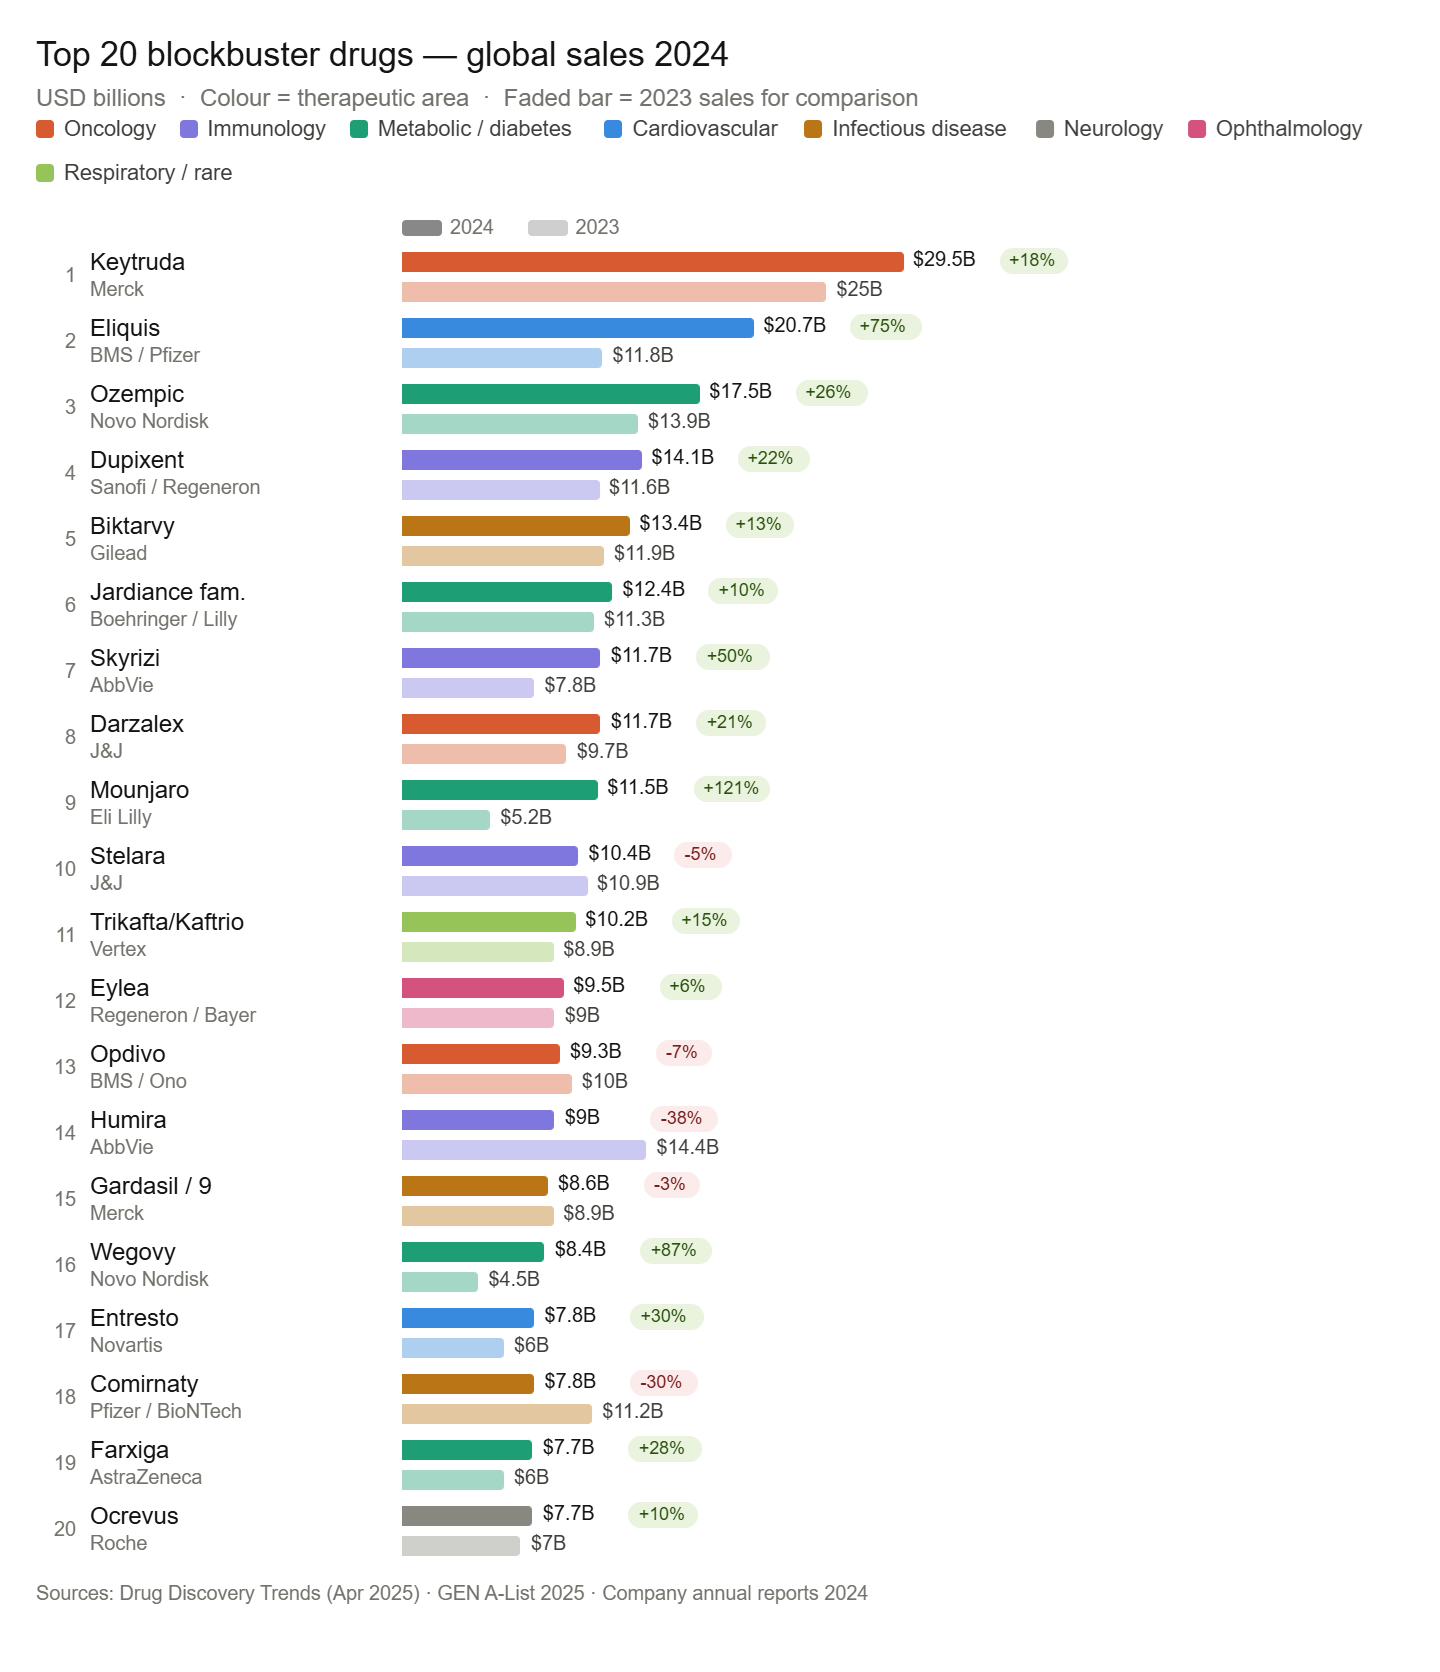
Some Largest drugs – In terms of a single drug, and how big the revenue can be, largest is Keytruda (Merck’s immunotherapy agent) with over $30 billion in revenue (2025). Think of it this way, that only 650 public companies in the world have revenues greater than that single drug.
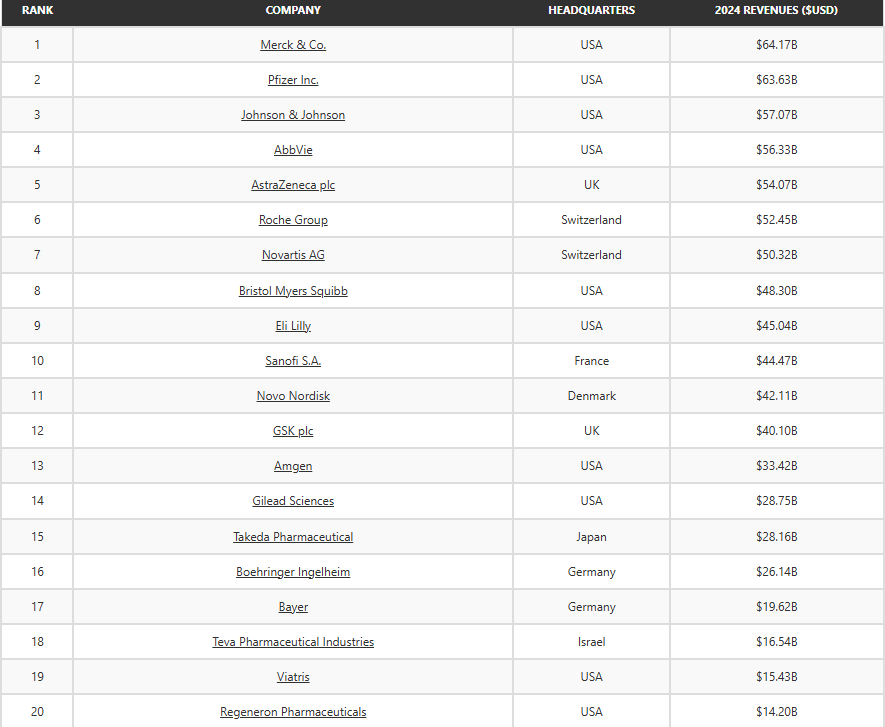
For context, here are the largest pharma companies in the world.
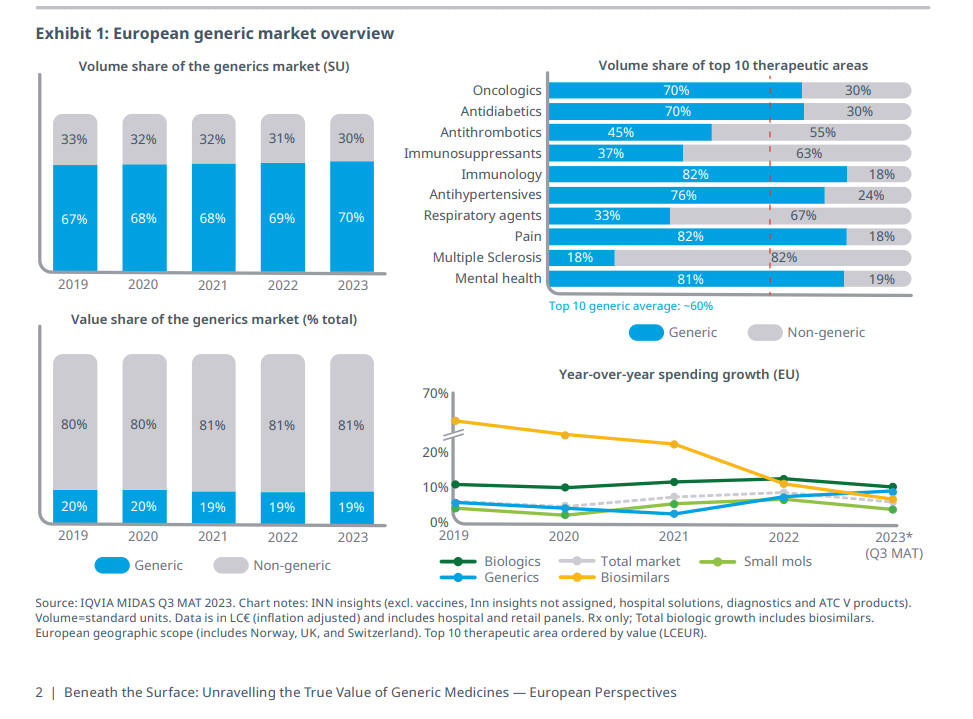
A look at the generic space. The generic drug markets is though smaller, follow the argument for understanding the impact of the volume of the market (from here)
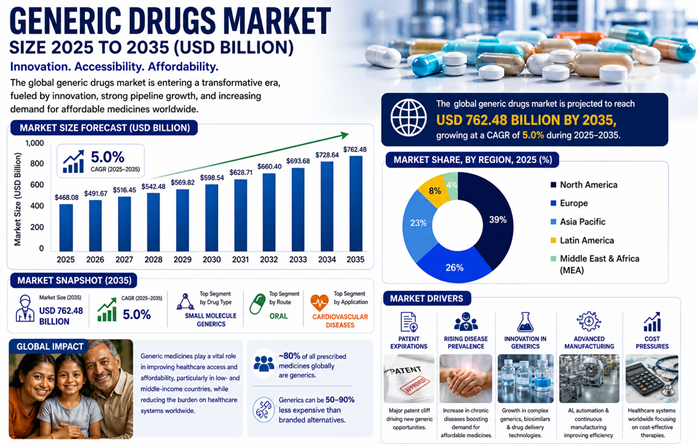
The size of the market can be misleading. In the sense volume of generic drugs far outpaces the patented medicines which provide the value numbers. The R&D goes into patent medicines, they sell for a while under patents, and then at some point, they are available as generic medicines. The sale still continues, and to get a sense of it, look at the European figures in the following chart. (from here)
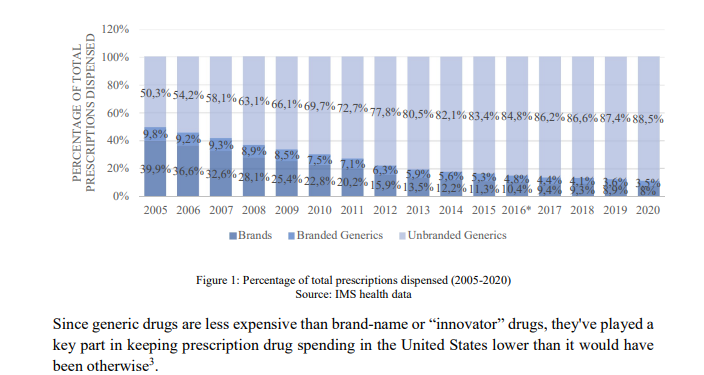
The whole culture of generic medicine is relatively new. In the US, for instance, in terms of volume “Only 19% of prescription medications in the United States were generic in 1984 (as assessed in total countable units, such as pills and capsules). However, 12 years later, this percentage had risen to 43% . The percentage of generic medicine prescriptions continued to rise over time, reaching 88.5% in 2020” (from here)
80% volume of generics, 87% value in branded – the inequality embedded in the system. Most of the world accesses healthcare through the cheap end. The expensive end is where the innovation, the profit, and the IP protection live. Both halves need each other, but they serve very different populations.
The generic market is the delayed dividend of pharmaceutical innovation. What is expensive and exclusive today becomes cheap and widely available in 15-20 years. The bigger problem is that for diseases primarily affecting poor countries, the original innovation often doesn’t happen at all, so the delayed dividend never arrives. But the silver lining is that many of those diseases are preventable by improving primary healthcare and other upstream changes (water, sanitation, nutrition).
10. To sum up,
Global healthcare is a vast and varied landscape. Over time, the landscape shifts and changes as new treatments and cures are developed. The landscape shifts even as the population of the world changes and shifts. And the dynamics are different in the rich world vs the poor world.
Even after putting together this post, I wonder at its aim. The aim was to better understand global healthcare, the nuances and the dynamics, and though it seems disparate and all over the place, I think some of the goal has been achieved. This is an entry point, and assembling this has led me to a few thoughts, reflections on the space:
There is the problem of negative space.The entire measurement framework of global health is built around events — deaths, DALYs, incidence, hospitalisations. All of these require something to happen. The absence of disease generates no data point. Victories are in a way, invisible until you look backwards over decades at shrinking disease series. Success looks like the vanishing of a category. Perhaps there are a few charts I can gather around that, but the point is that wellbeing, in its truest sense, leaves almost no trace in the data. All the more, one has to measure the metrics around primary healthcare, especially as the population in global south is set to increase tremendously. One of the things we saw in Sen’s ‘Development as Freedom’ notes is that the aim of any leader/ government is to maximise the freedoms available to the populace. Good health and wellbeing is an important freedom, perhaps the first freedom – and the measurement is either in negative data or in positive metrics of primary healthcare, preventative mechanisms, other development goals.
That brings to the pointer that the biggest leverage points are upstream of healthcare itself. Clean water, sanitation, nutrition, immunisation, urban design, these sit in infrastructure, civil engineering, and development economics, not in the health ministry’s budget. And yet their disease-burden impact rivals or exceeds most pharmaceutical interventions. The prevalence of diarrhea and other preventable diseases in 2026 when most of the money in research goes towards diseases of the relatively rich countries. The relationship between what ails people and where money flows is not logical, it is historical, institutional, and market-shaped. One of the intuitions is that primary healthcare (doctors, hospital beds, maternal nursing) and preventative awareness, and other development goals can play a big part in most of the low income countries disease burden, and thus improve the level of global health significantly. Most of the pharma research dollars go towards solving the ailments of rich countries, which is logical, but perhaps wellbeing of the human population is about smart approaches to it – more directional funding towards public health and primary healthcare (access, availability of good quality healthcare), including investing in the pipeline of people not just of treatment, especially in countries with rapidly expanding populations.
The pharma pipeline does not map onto the global burden of disease. R&D in Pharma aspires to solve hitherto incurable diseases. Oncology dominates R&D, and cancer does score heavily in DALYs, the metric used to measure disease burden, because it kills people in middle age in wealthy countries and the years lost are counted heavily. But measured by incidence, by how many people are actually affected, the picture is different: diarrhoea, neonatal infections, preventable respiratory disease touch far more lives. The pipeline follows one metric; the human reality is better captured by another. And the metric itself was not neutral (the original DALY methodology explicitly weighted productive adult life years more than the life of a newborn or an elderly person, a bias only corrected in 2010, long after funding priorities and pipelines had been shaped by it). Diseases of clean water, sanitation, and neonatal health, which account for enormous preventable suffering in low-income countries, attract thin pipelines and thin spend, because the patients cannot pay at a price that justifies the R&D investment. This is a capital allocation problem embedded in the structure of pharmaceutical markets, but it was a measurement problem first.
And hence, healthcare policy in low-income countries should not primarily be modelled on healthcare policy in high-income countries, because the disease burden is different, the infrastructure baseline is different, and the leverage points are different. Having said that the best models learn from what works well around the world. Healthcare is not one thing, it is a combination of many things going right together. It is an active work of learning and smartly applying those learnings to the situation at hand. Especially since some of the basic problems are not solved. The different data insights point to the same direction for me – better and smarter approaches to primary healthcare. Since the more difficult diseases are being addressed by the market anyway. What market is not addressing perhaps becomes the purview of government and policy response. And good health is as much about prevention as it is about treatment. The wholeness of the wellbeing has to be considered. The highest-leverage interventions in global health are not in the health budget at all — they are in water, sanitation, nutrition, and primary care access, and they disproportionately fall to governments and international institutions that the market has no reason to serve.
*
That we are mortal is the only truth surely available to us in our lifetimes. And at some point the fight with disease and age is a losing battle. But that while we live, that life be well, is the objective that any good policy can pursue. That aspiration, a life well lived, scales from the individual to the population, and it is what good policy, at its best, is trying to serve. The degrees of spend and definition of what is treated and is well changes as geography and income level changes, but the first access to good primary healthcare is still the first objective for a better human world. The other end of treatment is being addressed by the markets, for the rich world, cutting edge, patented medicines and for the not so rich world, in form of generics. What the market solves, government can enhance. What only government can solve should be at the top of the agenda — and it is, or ought to be, what the SDGs are reaching toward.
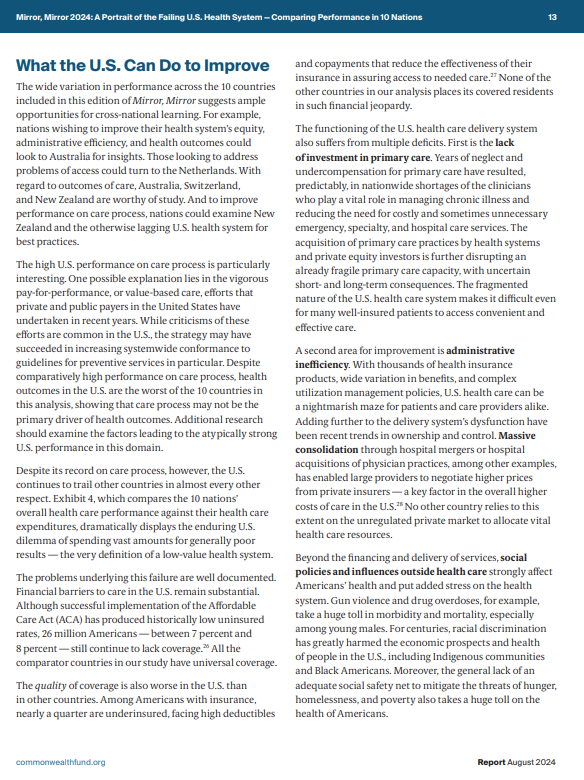
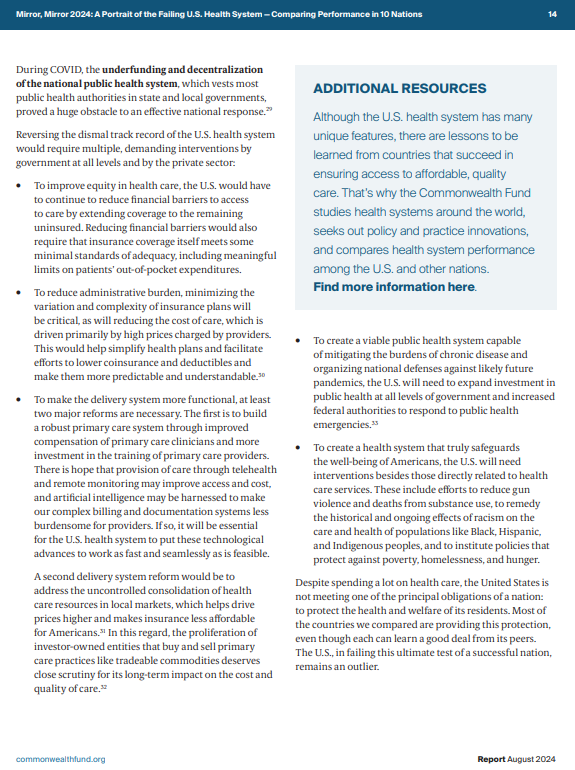
Annexure – For those interested, these two pages from the Mirror Mirror report talk about how perhaps US Healthcare can be made better (given its high spend, its hodge podge nature and still relatively poor outcomes). It is worth reading to understand the complexity of the space and how changes at a few critical leverage points can enhance the system.

Notes on Lithium

A perspective on government finances – deficits and debt
