On Global Wealth and Assets
Trying to understand the global wealth and total global assets, against the investable world, I came across this report by McKinsey which details the global balance sheet, and this report by Goldman. Following are some notes from that exploration, on the internet as well as several deep dives with Claude. Numbers are sourced from various sites and are for directional reference only. Many of the charts are AI made, open to errors.
1. GLOBAL WEALTH & THE WORLD’S BALANCE SHEET
Global Wealth is ~$600 trillion. (2024-end)
Consider a balance sheet: there are assets that are owned, there are liabilities that are owed, and the balance or the residue is the equity or net worth of the entity under consideration.
Net Global Wealth is the residue in the global balance sheet (Global aggregated Assets less Global aggregated Liabilities).
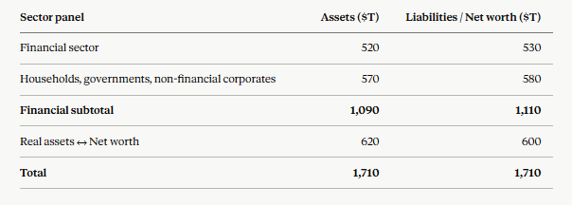
The world has massive financial assets and liabilities owned and owed by the financial sector, households, governments and non financial corporates. The size of the global balance sheet or the global asset side totals to $1,710 trillion (end 2024 numbers). This includes $1,090 trillion worth of financial assets, and $620 trillion worth of real assets. The financial asset chunk is pretty much netted off by financial liabilities of $1,110 trillion (in a true global balance sheet, it would be completely netted off, but since this is an extrapolation – more later). Thus resulting in a net worth or residue or balance of $600 trillion which is an estimate of total global wealth.
A brief summary of the chart that follows:
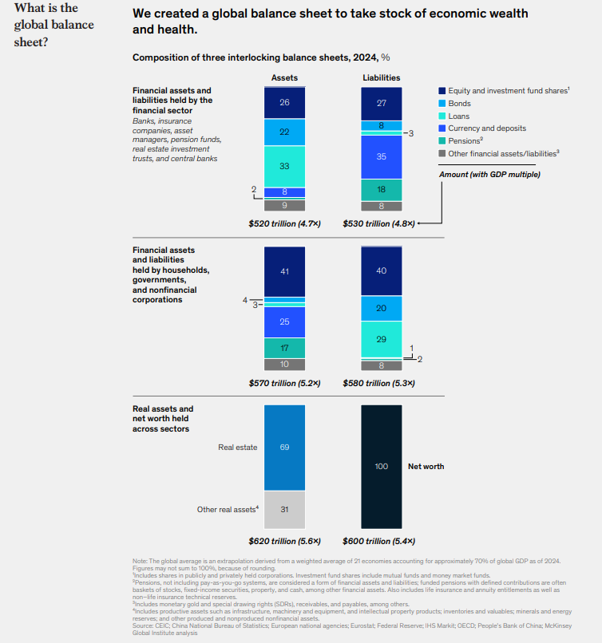
The financial assets net off each other. For instance,
- A government bond is an asset for the pension fund, liability for the government that has issued it.
- A bank deposit is an asset for the depositor, liability for the bank taking the deposit.
- A mortgage is an asset for the bank extending it, liability for the household.
- A share of stock is an asset for the shareholder, equity liability of the issuing company.
One thing to note here is that this is an extrapolation. The “global” figure reflects a GDP-weighted average of 21 countries: Australia, Belgium, Canada, China, Czech Republic, Denmark, Finland, France, Germany, Ireland, Italy, Japan, Korea, Mexico, Netherlands, Poland, Romania, Spain, Sweden, UK, and the US. These countries account for about 71 % of global GDP as of 2024. So the “global balance sheet” is the balance sheet of rich, relatively financially-deep economies, plus China, scaled up by GDP weight. (And a caution for what follows: the net-worth figures across years come from different reports with different country samples — read them as snapshots and trends, not a precise annual series.)
Following are the tabulated $ numbers, the above chart converted to table.
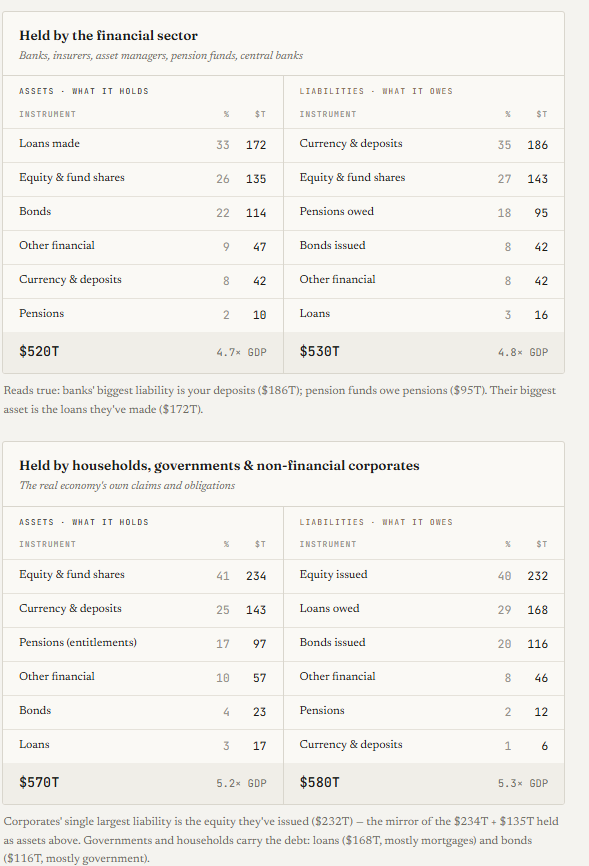
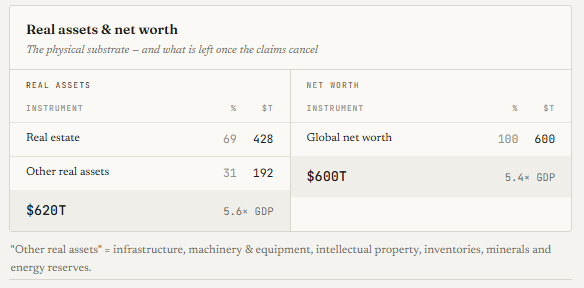
Net worth ($600T) sits just below real assets ($620T) because since this balance sheet covers 21 economies, not the planet, and those economies are, on net, debtors to the rest of the world. If we could scale up to the whole world, the gap would close. With no “abroad” to borrow from, global net worth is global real assets. The $20T is the seam where the sample doesn’t quite close.
2. WEALTH AND GDP or THE MYSTERY OF WEALTH GROWTH
So total net wealth in the world is $600 trillion. (Extrapolated, directional reference number).
To contextualise this number and understand its evolution, lets consider the global GDP. The global GDP is c. $111.7 trillion (2024). As a stark aside, between them, the top 20 countries contribute to c. 81% of the global output.
Now, Global GDP is a flow number. If the wealth were a residue in the balance sheet, which is a stock number, GDP helps understand some of the difference or flow between two balance sheets of different periods.
GDP is akin to global revenue, and only a small portion of it gets saved (26% gross, 9% net of depreciation) or flows into the global balance sheet, and built into new assets expanding the global balance sheet (see the following chart). The rest of it is consumption.
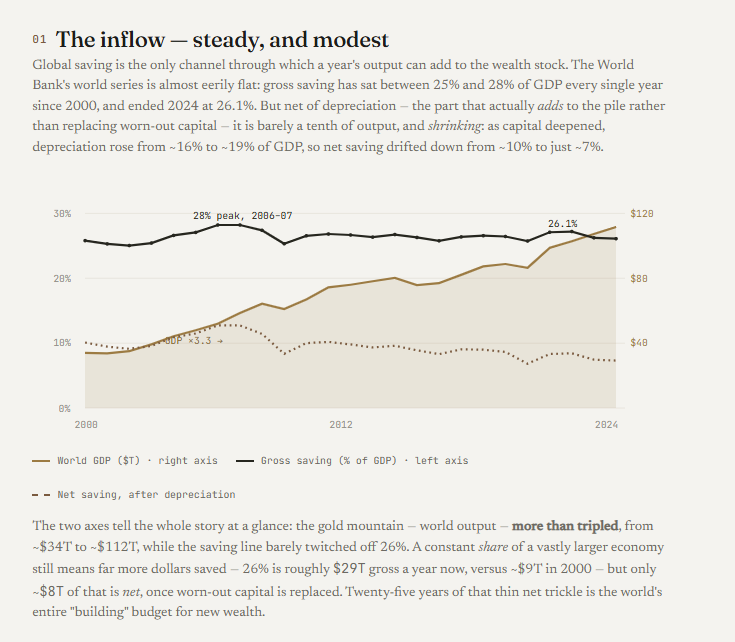
Yet, the world’s wealth has grown faster than the savings reinvested every year. The ratio of wealth to output has grown from 4.7 times (2000) to 5.4 times (2024).
Again, the current (2024 end) total net wealth in the world is $600 trillion. This used to be $160 trillion in year 2000. Of the $440 trillion the world grew richer since 2000, only about $162 trillion is explained by global savings flowing into assets. The other ~$278 trillion or nearly two-thirds was existing assets re-priced upward.
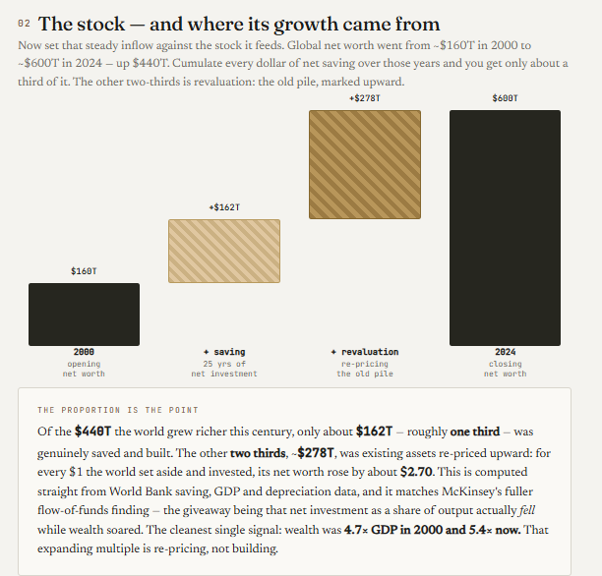
It seems to imply that the world is marking up what already existed.
Which then raises the questions that what does it imply as market belief? What does it mean for the future? And what does it mean that the world has grown richer mostly by re-pricing its own past?
Here, it is worth understanding that repricing happens because the value of future expectation goes up. During the period considered, the interest rates have been going down (see the next two charts). An asset’s price is its expected future cash flows divided by a discount rate. If the discount rate falls, the valuation or expected future value goes up. In other words:
rates fell → the discount rate on every long-duration asset fell → property and equity re-priced upward → wealth-to-GDP climbed from 4.7× to 5.4× → and the assets that gained most were the longest-duration ones (land, housing, growth equities)
For forty years, the rate fell (Based on US 10-year Treasury yield)
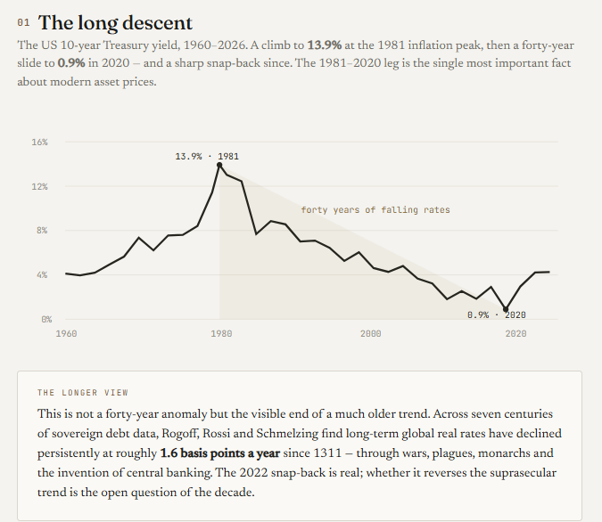
But lets zoom in and look at the period of the comparison (2000 – 2024). As the discount rate collapsed from 6% to under 1%, the world’s wealth grew from 4.7× GDP in 2000 to a peak near 6× around 2020–21. When rates started moving back up, the multiple fell to 5.4×.
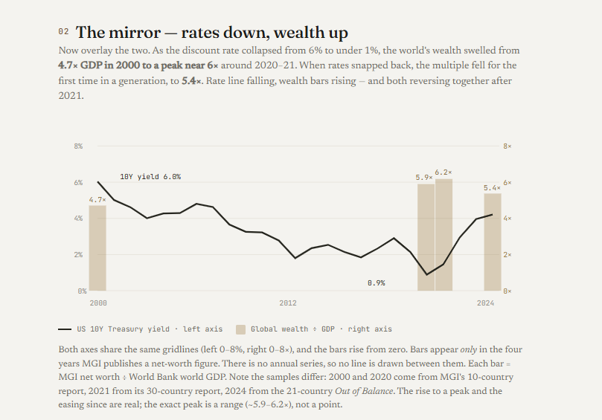
This still leaves us with the takeaway that wealth is so much a function of price and valuation. And if it is so, it is a question worth exploring deeper as to where are these prices really set.
3. THE INVESTABLE UNIVERSE
The balance sheet shared earlier approximates the world in its entirety, the assets, a large section of which is Real Estate. And the listed investable universe such as equity markets, debt markets are just small parts.
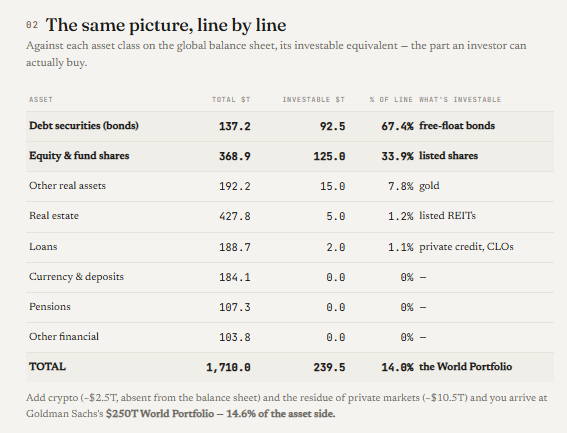
The world has $369 trillion of equity (on the asset side), of which $125 trillion (or perhaps more by some counts) is investable float. The world has $326 trillion of debt (bonds and loans), but only $92 trillion is investable. The world owns $427 trillion of real estate, of which, only a sliver is investable in public markets, the rest is private markets/ one on one contracts.
Following are the items from the balance sheet reorganised for better grasp. The table also shows what the investable portion (in public markets) of the line item is.
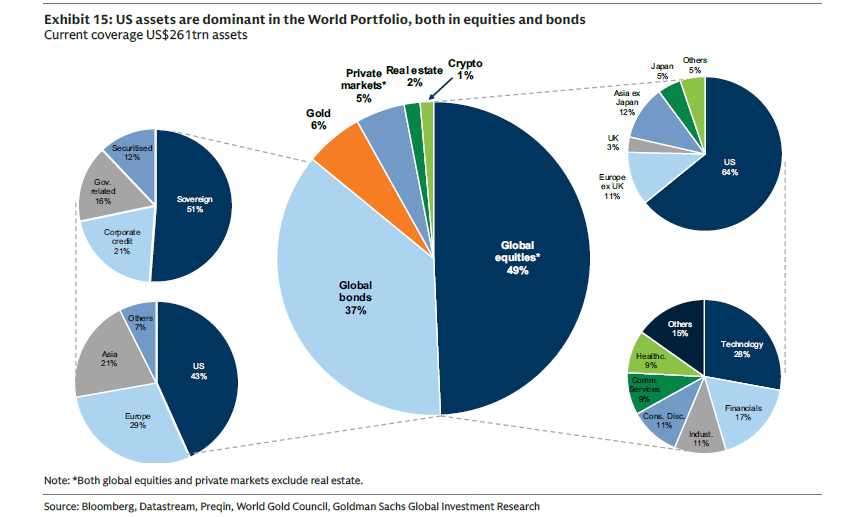
Following is a snapshot of the public markets of the world, the above 14% equivalent. (Chart from Goldman Sachs paper 74, it mentions $261 trillion assets). So investable in the public markets forms a small portion of the entire asset side.
Lets consider the assets one by one across Equity, Debt, Real Estate and the rest of the assets (both investable and private).
a) EQUITY
The total Equity in the world is close to $369 trillion, of which, close to one-third is listed or available in the public markets. Equity was discussed in detail in the S&P 500 post. To read, click here.
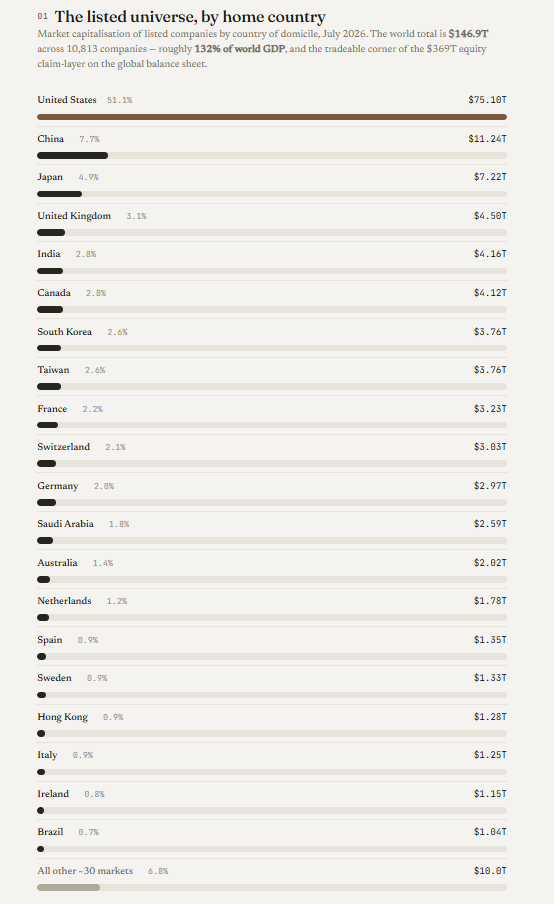
Here two questions come up that are worth further exploration. i) How are the public markets distributed and ii) How is the rest of the unlisted portion priced, the portion which is not traded publicly.
Following is a snapshot of the listed Equity universe by home country.
Now, there is still two-thirds of the world’s equity in the balance sheet. The same is generally carried at book value.
Hold that thought against the following P/BV multiples of different markets. (Source – Damodaran data sets)
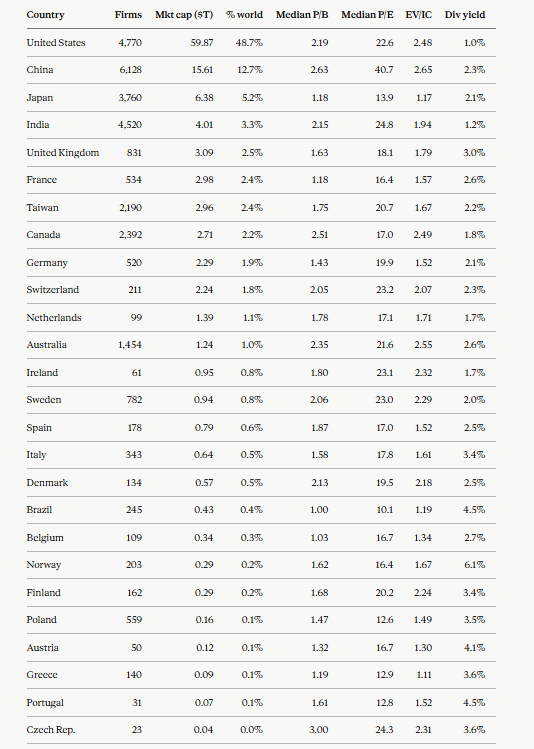
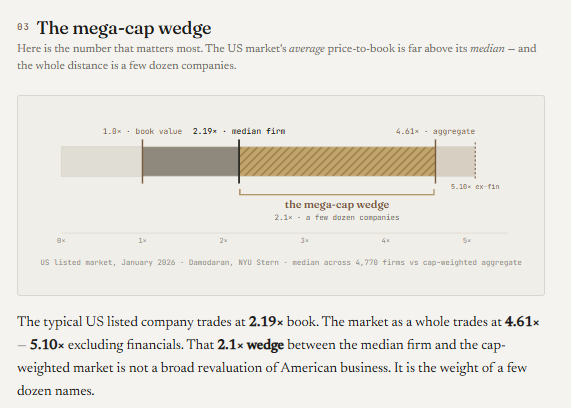
Further, to understand the impact of Magnificent 7 (further to the chart in S&P 500 post), consider the following. The median P/B is close to 2.19 times in the US, but the market trades at 4.61 times. The difference is attributed to a few dozen top companies.
b) DEBT
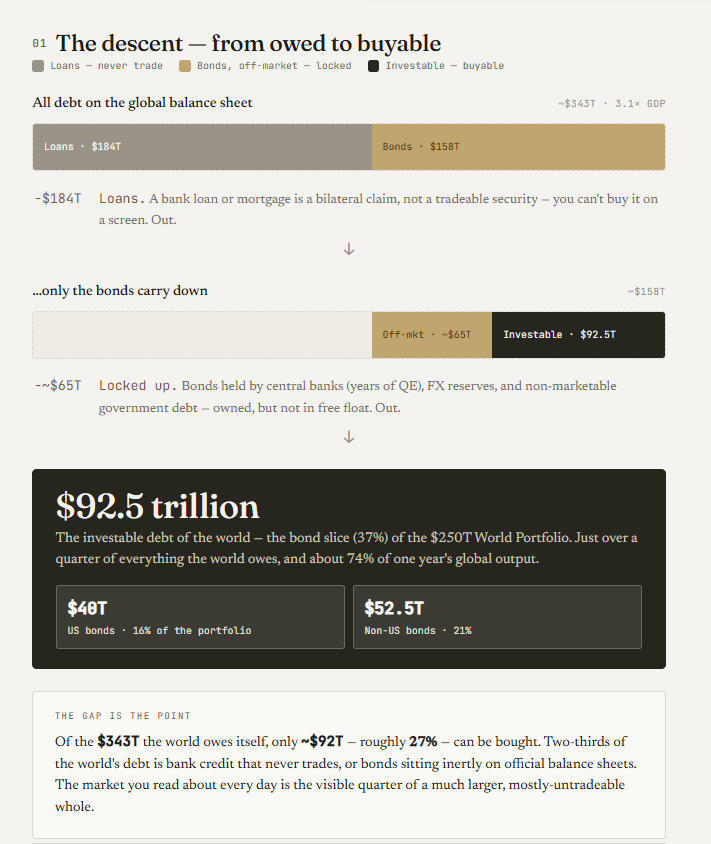
Of the $1,110T of liabilities, debt is c. $343 trillion. Where the rest of that claim stack is equity (~$369T), currency & deposits (~$184T), pensions (~$107T) and other (~$104T), debt is specifically the part carrying a fixed repayment obligation, which is exactly why it’s the layer that can force a crisis when the real assets behind it are re-priced downward.
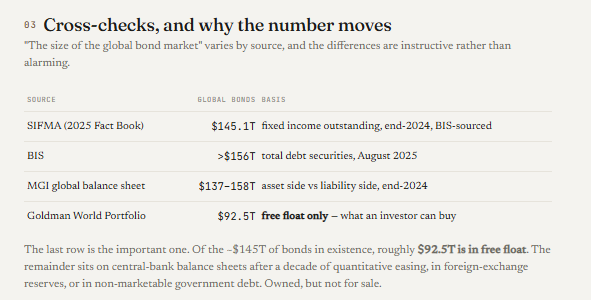
Following chart shows the ‘investable’ portion of the Debt markets from the total debt on the Balance Sheet. On the global balance sheet, debt (loans plus bonds) comes to roughly $343T, about 2.7× world GDP. But “debt outstanding” and “debt you can invest in” are very different sets. The investable debt is far smaller, close to $92 trillion free float (The debt and bond portion in the Goldman global portfolio pie above).
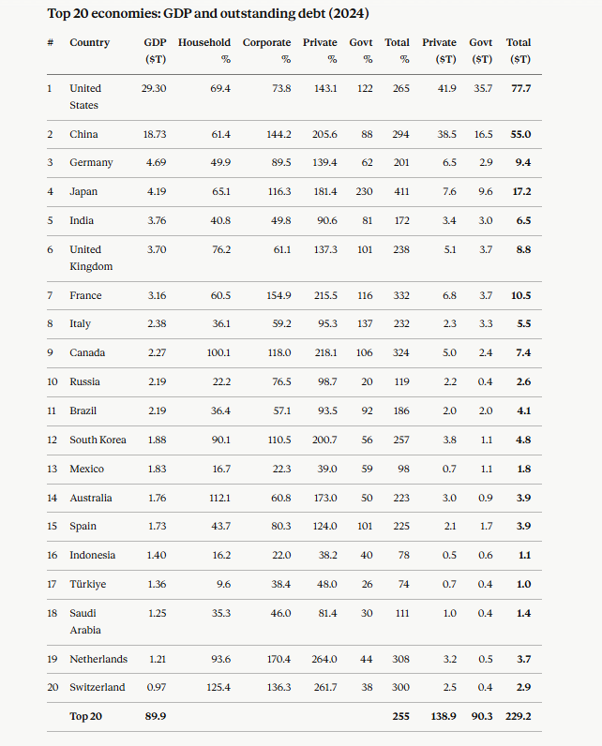
Following is the 2024 data on GDP and most recent data on Debt.
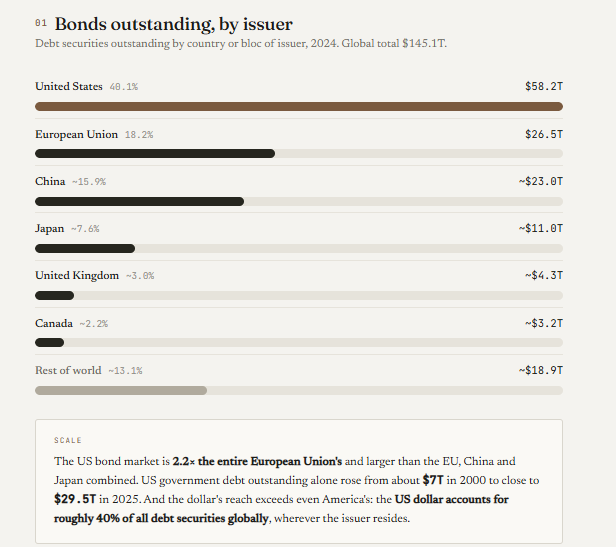
Following is the distribution of the above mentioned $145 trillion of Fixed Income Outstanding.
c) REAL ESTATE
The largest asset pool in the world, at $430 trillion, close to three times the listed equity markets of the world. The market is contractual rather than listed the way financial assets are freely and partly tradeable.
Real Estate includes residential real estate (the key bulk, close to 70%), commercial real estate and farmlands.
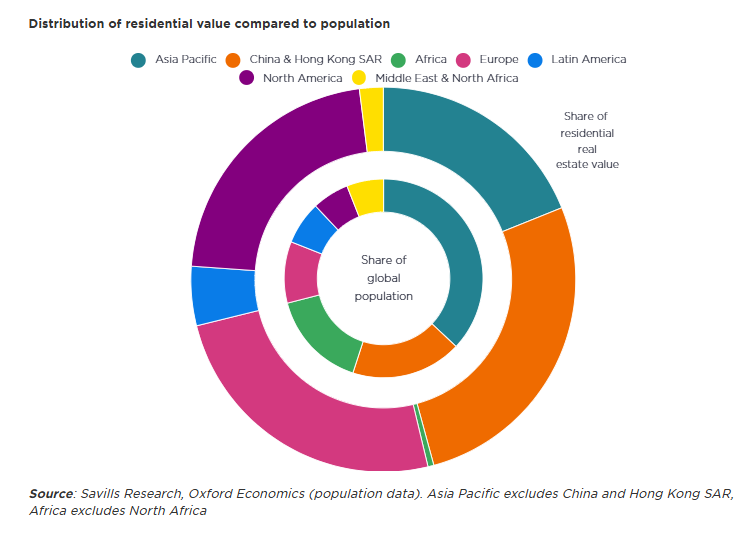
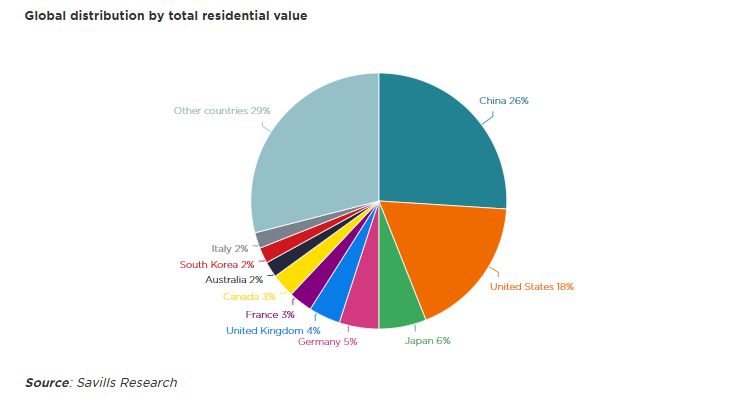
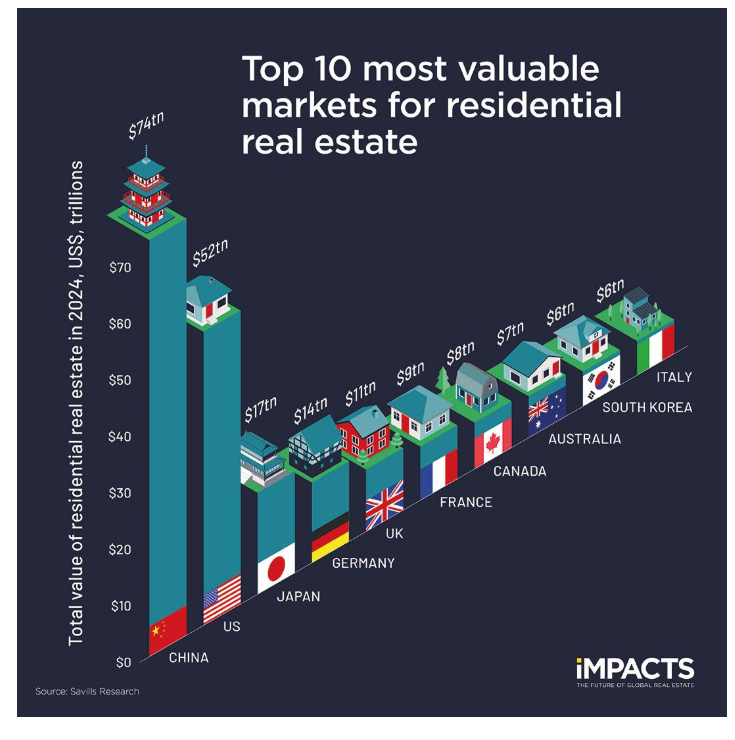
Here, the following charts tell the story well as to the distribution of residential real estate. The world is unequal, there is no better asset to understand it than real estate.
d) REST OF THE ASSETS
Following is the way the rest of it is priced:
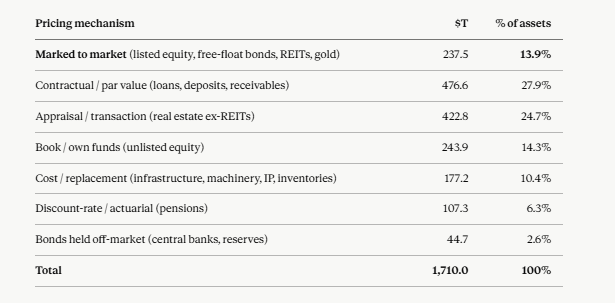
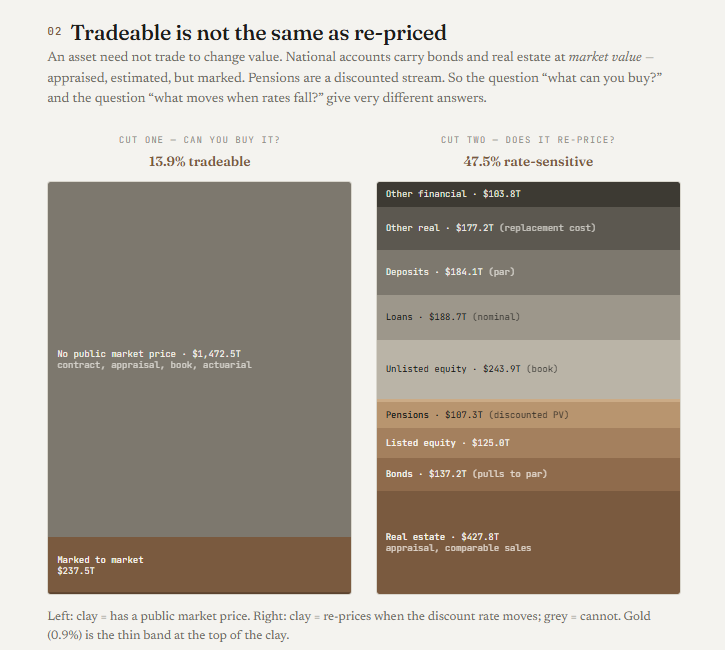
This is why the great revaluation of 2000–2021 was so unevenly recorded. Falling interest rates lifted the value of every long-duration asset on earth. But only the marked-to-market seventh could show it. Listed equities re-rated in public, hour by hour. Unlisted firms carried on at book. Deposits sat at par. Houses re-rated slowly, through a decade of transactions. Pension liabilities ballooned in silence.
4. A SHORT NOTE ON AN UNEQUAL WORLD
The Net Wealth of the world is $600 trillion. If looked at it straightforward, the average wealth is $74,400 per person. But the world is not such. The world is distributed very unequally and the way the wealth creation works, where capital helps make more capital, that gap is a difficult gap to traverse.
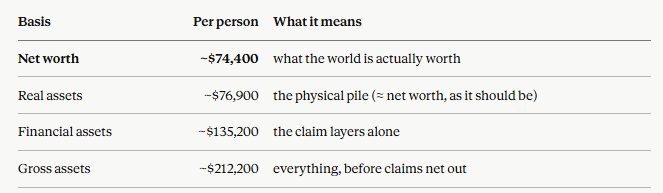
From another source, the median wealth is $8,700 per adult person.(UBS)
To understand that gap, consider the following chart from McKinsey report.
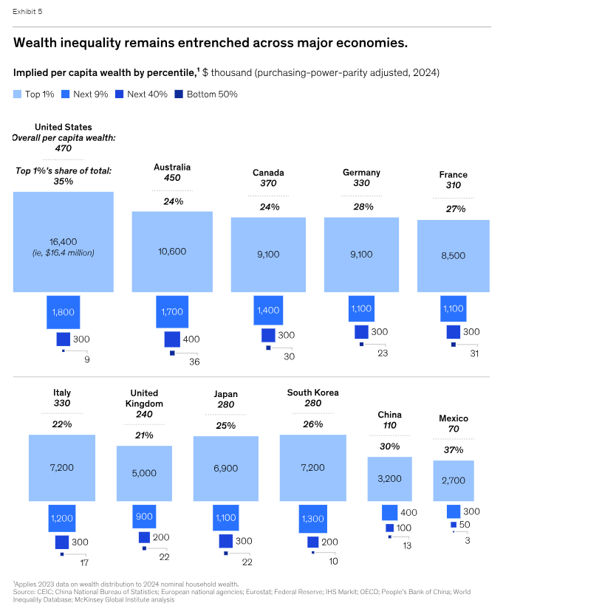
In the end the sum comes to about $74,000 a head, the world’s net worth, spread evenly across every person alive. But it is never spread evenly, and the figure knows it. The typical adult holds nearer $8,700; the average is lifted almost tenfold by those at the top. So the number is true and untrue at once; a real measure of what exists, and a false picture of who has it.
As to how capital makes capital – the mechanism is not mysterious. As houses and shares re-priced upward, those who already held them grew richer. And where households chased it, they chased it with debt; the most heavily-mortgaged households on earth sit in exactly the countries where housing re-priced hardest, Australia, Switzerland, Canada, the Netherlands. Borrowing to buy into a rising asset is how the middle tries to stay on the ladder. It is also how the gains of the rise are quietly transferred to whoever sold.
The distance between $8,700 and $74,000 is not a rounding error. It is the entire subject of section 3, restated as arithmetic. A world that grows richer by re-pricing what it already holds is a world that grows richer for those who already hold.
So when we say wealth grew by re-pricing rather than building, we should be precise about what was re-priced. Not the economy. Not even the stock market. A slice of it, and the people who happened to hold that slice.

About The Author
