Two centuries of growth in one table | a story in numbers
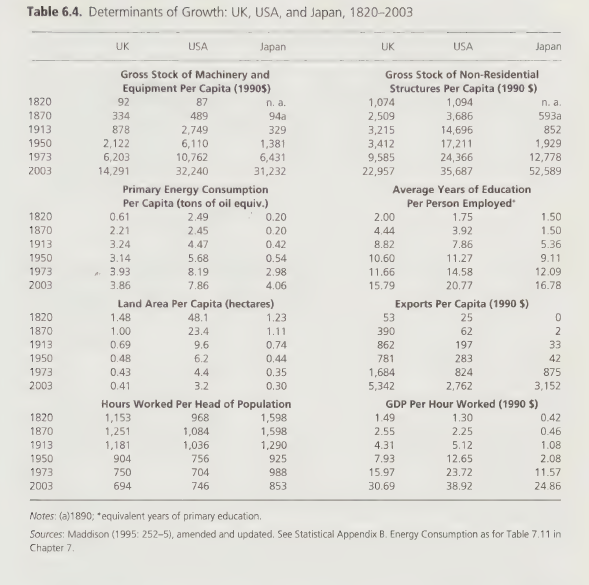
Consider the following fascinating table from Angus Maddison’s book Contours of the World Economy 1- 2030 AD (also available here) .
For the whole of the capitalist epoch from 1820 onwards, the table presents growth accounts for two successive lead countries, the UK and the USA, back to 1820 and Japan, the most successful catch-up country, for the whole period of its ‘modern economic growth’. (Lead countries are those whose economies operate nearest to the technical frontier. Follower countries have a lower level of labour productivity or GDP per capita)
The book presents data upto 2003. (Released in 2007)
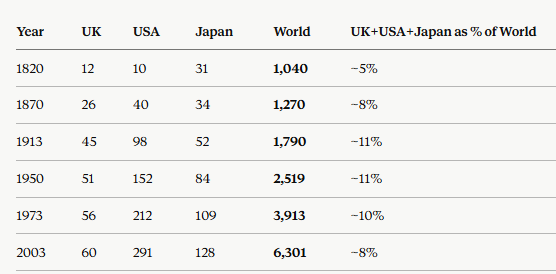
Lets read the table closely and the story it tells. To provide context, here are the population numbers for the above countries for that period in millions.
As a context to why this era is interesting:
“We now have enough evidence to discern five phases from 1820 to 2003 in which the momentum of growth and fashions in economic policy differed substantially. The years 1950–73 were a golden age of unparalleled prosperity. World GDP rose at an annual rate of 5 per cent, per capita GDP near 3 per cent and world trade almost 8 per cent a year. There was a significant degree of convergence in per capita income, with most regions growing faster than the US (the lead economy). After 1973, there was a marked slowdown, with substantial divergence between different regions, and performance in many of them below potential. Nevertheless, on a world basis, this latest phase was the second-best since 1820. It is clear that what Kuznets called ‘modern economic growth’, has been much faster in all its phases than in the preceding centuries. From the year 1500 to 1820, world per capita income rose 0.05 per cent a year. From 1820 to 2003 it averaged 1.25 per cent—25 times as fast.
The data stops at 2003. It would have been interesting to read further thoughts on the last 25 years of growth as well, with the catch-up played by countries like China.
CHARTS | To consider the table better, here is a representation in charts (with AI help), an interactive version which allows to visually perceive the changes in the different factors of production.
A few notes as one looks at the table and the charts:
POPULATION | First, the population itself. Today, USA is 342 million people. From 10 million of 1820, it has grown 34 times in 200 years. Meanwhile, UK grew around 6 times to ~70 million and Japan 4 times during the same period. That explains some of the shift in some ratios in the table above.
Between them in 1820, UK, US and Japan held 5% of world population of around 1 billion people. The population of US has seen the most dramatic shifts in these last 200 years.
MACHINERY & EQUIPMENT | In this section of the table/chart, notice the beautiful catch-up played by Japan on a per capita basis. But if one keeps in mind the corresponding population growth numbers, the overall stock of machinery was significantly higher in US during this entire period. This era of technical progress enhanced the productivity of other factors of production as well.
NON-RESIDENTIAL STRUCTURES | Here, which is infrastructure of the country, Japan leads the way on per-capita basis. But overall, US has the highest value of non-residential structures.
Both machinery and equipment and infrastrutcure have an important multiplier role to play in improving the productivity of other factors of production.
PRIMARY ENERGY CONSUMPTION | USA has been one of the highest energy consuming economies of the world, and the result is seen in its economic growth. It made lavish use of its timber resources in the nineteenth century. The UK made extensive use of coal in the nineteenth century. And though Japan has increased per capita significantly during the period under consideration, it is nowhere close to the energy usage in the US.
AVERAGE YEARS OF EDUCATION | The formal education level of those in employment increased signifciantly in all three countries. This is linked to the technical progress during the period which is reflected in the other factors of production as well (machinery and non residential property). The increasing complexity of production processes required better educated people to make it operational and the involvement of educated people in R&D helped institutionalise the process of innovation. *The formal education experience of those in employment – weighted by the earnings differential associated with years of primary, secondary, and tertiary.
LAND AREA PER CAPITA | As population increased in these countries, the land available per capita decreased. But US, still has 10 times more land per person than say Japan or UK.
EXPORTS PER CAPITA | “International specialization increased very significantly. The ratio of exports to GDP rose from 3 to 25 per cent in the UK and from 2 to nearly 10 per cent in the US between 1820 and 2003. Japan was an almost completely closed economy until the 1850s; between 1870 and 2003 its export ratio rose from 0.2 to 15 per cent of GDP.”
HOURS WORKED PER HEAD | Leisure increased as technical progress set in. Labour input per heas of population dropped by 47% in Japan, 40% in the UK and 23% in US between 1820 and 2003.
GDP PER HOUR WORKED | This is where all the factors come together to enhance the GDP per hour of labour. See the significant increase in all three countries over the period.
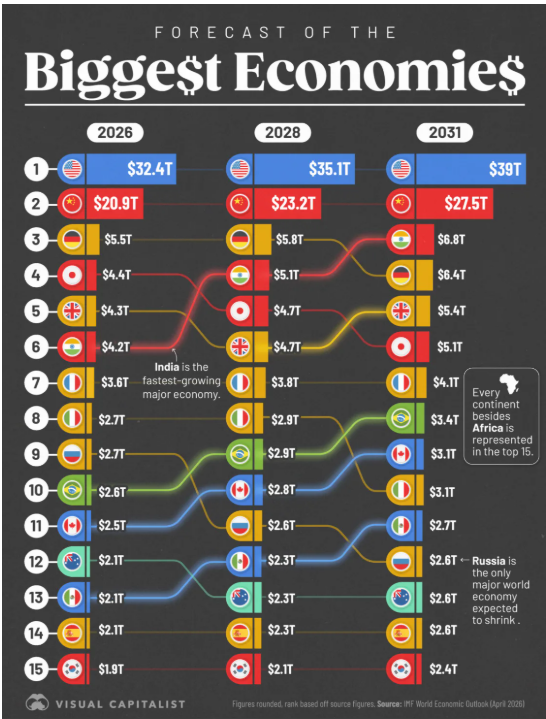
The picture today
Perhaps here, a reminder of where some of these countries are today in terms of overall economy (see the following chart). US is unparalleled in many ways due to many factors, its population growth mainly thanks to immigration, massive land area and resources, its entrepreneurial culture. The way the world is set up, the way geography and resources are distributed, and the way countries have compounded on their advantages of different factors of production over the years, it is worth a wonder whether the world can see another US like country? In terms of its economy.

A perspective on government finances – deficits and debt

S&P 500 – some pointers
