S&P 500 – some pointers
A brief post to note some stark pointers about the Equity Capital Markets, particularly S&P 500. (All numbers are for directional reference only, compiled from various sources).
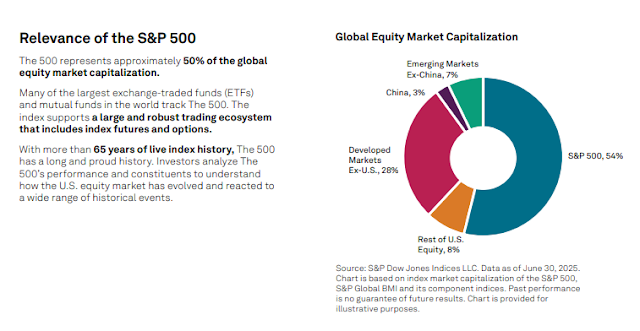
- SIZE | S&P 500 companies (Total Market Cap ~ $67 trillion) constitute 54% of the global equity markets. See the following chart (from here).
- In 2006, the S&P500 was valued at around $12-13 trillion. In 20 years, by 2026, the S&P 500 has grown to $67 trillion.
- The US itself has been dominant in global equities (though not always), see this attached chart.
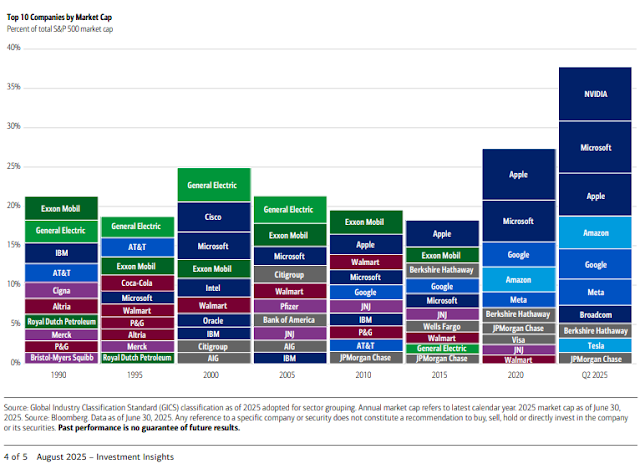
- TOP 10 | Of the S&P 500 companies, the top 10 companies (Nvidia – $4.84 trillion market cap, Apple, Alphabet, Microsoft, Amazon, Broadcom, Meta, Tesla, Berkshire Hathaway, Eli Lily) form 37.5% of the total S&P500 market cap. This is a significant growth in concentration of top 10 companies from say 1990s. They formed ~20% in 2005. See the following chart.
- Given S&P 500 make 54% of the global markets, the top 10 companies seem to command ~20% of global market cap. A very high concentration perhaps.
- Another look for sector composition and its changes over the years – an illuminating chart on how tech has come to dominate the market
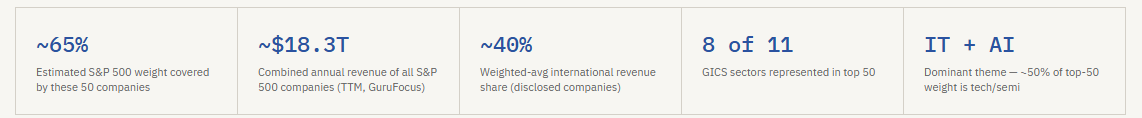
- REVENUE MIX | One would think US being the largest economy ($32.3 trillion, followed by China at $20.9 trillion which is followed by Germany at $5.5 trillion), is home to large companies of the world. But around 28-40% of the revenue of S&P 500 companies is sourced internationally (Goldman, Apollo). Now to further understand this, see this attached breakdown of revenue of top 50 S&P 500 companies. (Created with AI)
- The total revenue of S&P 500 companies is c. $18.3 trillion (Gurufocus)
- So, $18 trillion in annual revenue, against a market cap of $67 trillion. And roughly $7 trillion of that revenue originates outside of the United States.
- The top-50-by-revenue combined figure is closer to $10–11T, roughly 60% of the index total. The revenue giants (Walmart $680B, Amazon $638B, UnitedHealth $400B, Exxon $400B) carry enormous revenue but modest index weight
- RETURN DRIVERS | Between 2012 and 2021, the Total Shareholder returns were driven 40% by Earnings growth and 41.6% by multiple change. See this attached chart. To update the analysis, working with AI to recreate it with current data, see attached analysis.
- The most striking result is what happened to P/E multiples. According to one source, the trailing P/E went from 14.87× at end-2011 to 23.11× at end-2021, and then further to 29.6× at end-2025. Contributing roughly 5% per year to annualised return.
- For a moment, consider this P/E multiple as a standalone thing and what it implies about future expectations.
- P/E multiples mean-revert over long periods. The historical average is around 16-18×. A contraction from 29× to even 20× over a decade would subtract roughly 3% per year from total returns
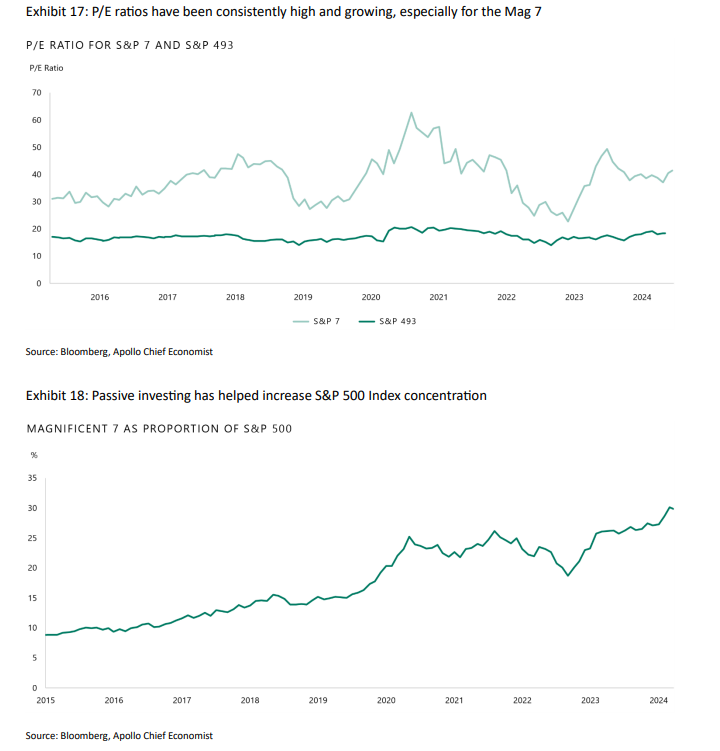
- Still on the P/E multiple, here is another look breaking it down across the 7 and 493 companies. The index’s elevated multiple is not a market-wide valuation judgment, it is a concentration measurement. The S&P 493 trades at its hundred-year average. Everything unusual about this market lives in seven companies and 30% of index weight.
- Reported EPS went from $129 to $223 (end 2024), a 73% nominal increase. If we consider inflation, and strip it out (38% inflation for the period of 13 years), real EPS growth is roughly 25% over 13 years, or about 1.7% per year in real terms.
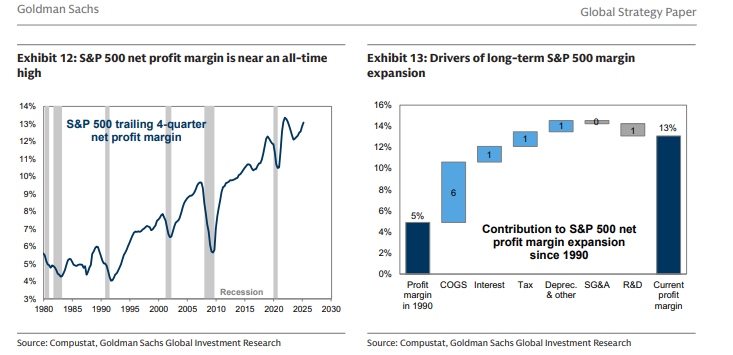
- Net margins on the S&P 500 went from roughly 8-9% in 2011 to 11-12% in 2024. Following is a chart looking at it from 1990. Note how the COGS have contributed to margins over time, it has been possible because of global manufacturing updates over the last 2-3 decades. (“The pivotal Uruguay Round of GATT, that took place in 1986, included services and capital as well as textiles and agriculture and was the first time that developing countries played an active role. This marked the start of a new era of globalisation that was to expand rapidly following the collapse of the Berlin Wall in 1989, the signing of NAFTA in 1994, India joining the WTO in 1995 and, finally, followed by China joining in 2001. Between 1995 and 2010 the pace of world trade growth grew at twice the pace of World GDP. (attached another chart)” – from here)
- GROWTH OF THE MARKET | Returns do not completely explain the significant growth of the S&P 500 over the past two decades. Where the S&P 500 has returned 13.1% annually from 2012 (until 2024), there has been meanwhile new money flowing into the markets (new capital raise), new listings that add to the total growth. Here is a breakdown of that growth. Again, built with AI, usual caveats of potential errors.
- WHO OWNS THE S&P 500? | The above analysis raises a wonder and a question, as to who owns the S&P 500. Here is one way of seeing it.
- To complement it, attached here is an analysis of the top 50 companies and their founder-owners. The takeaway is that barring a few companies, founders/owners own almost minimal in the top 50.
- The ownership changes as one goes down the list of companies in S&P 500. The founder ownership decreases and institutional ownership increases.
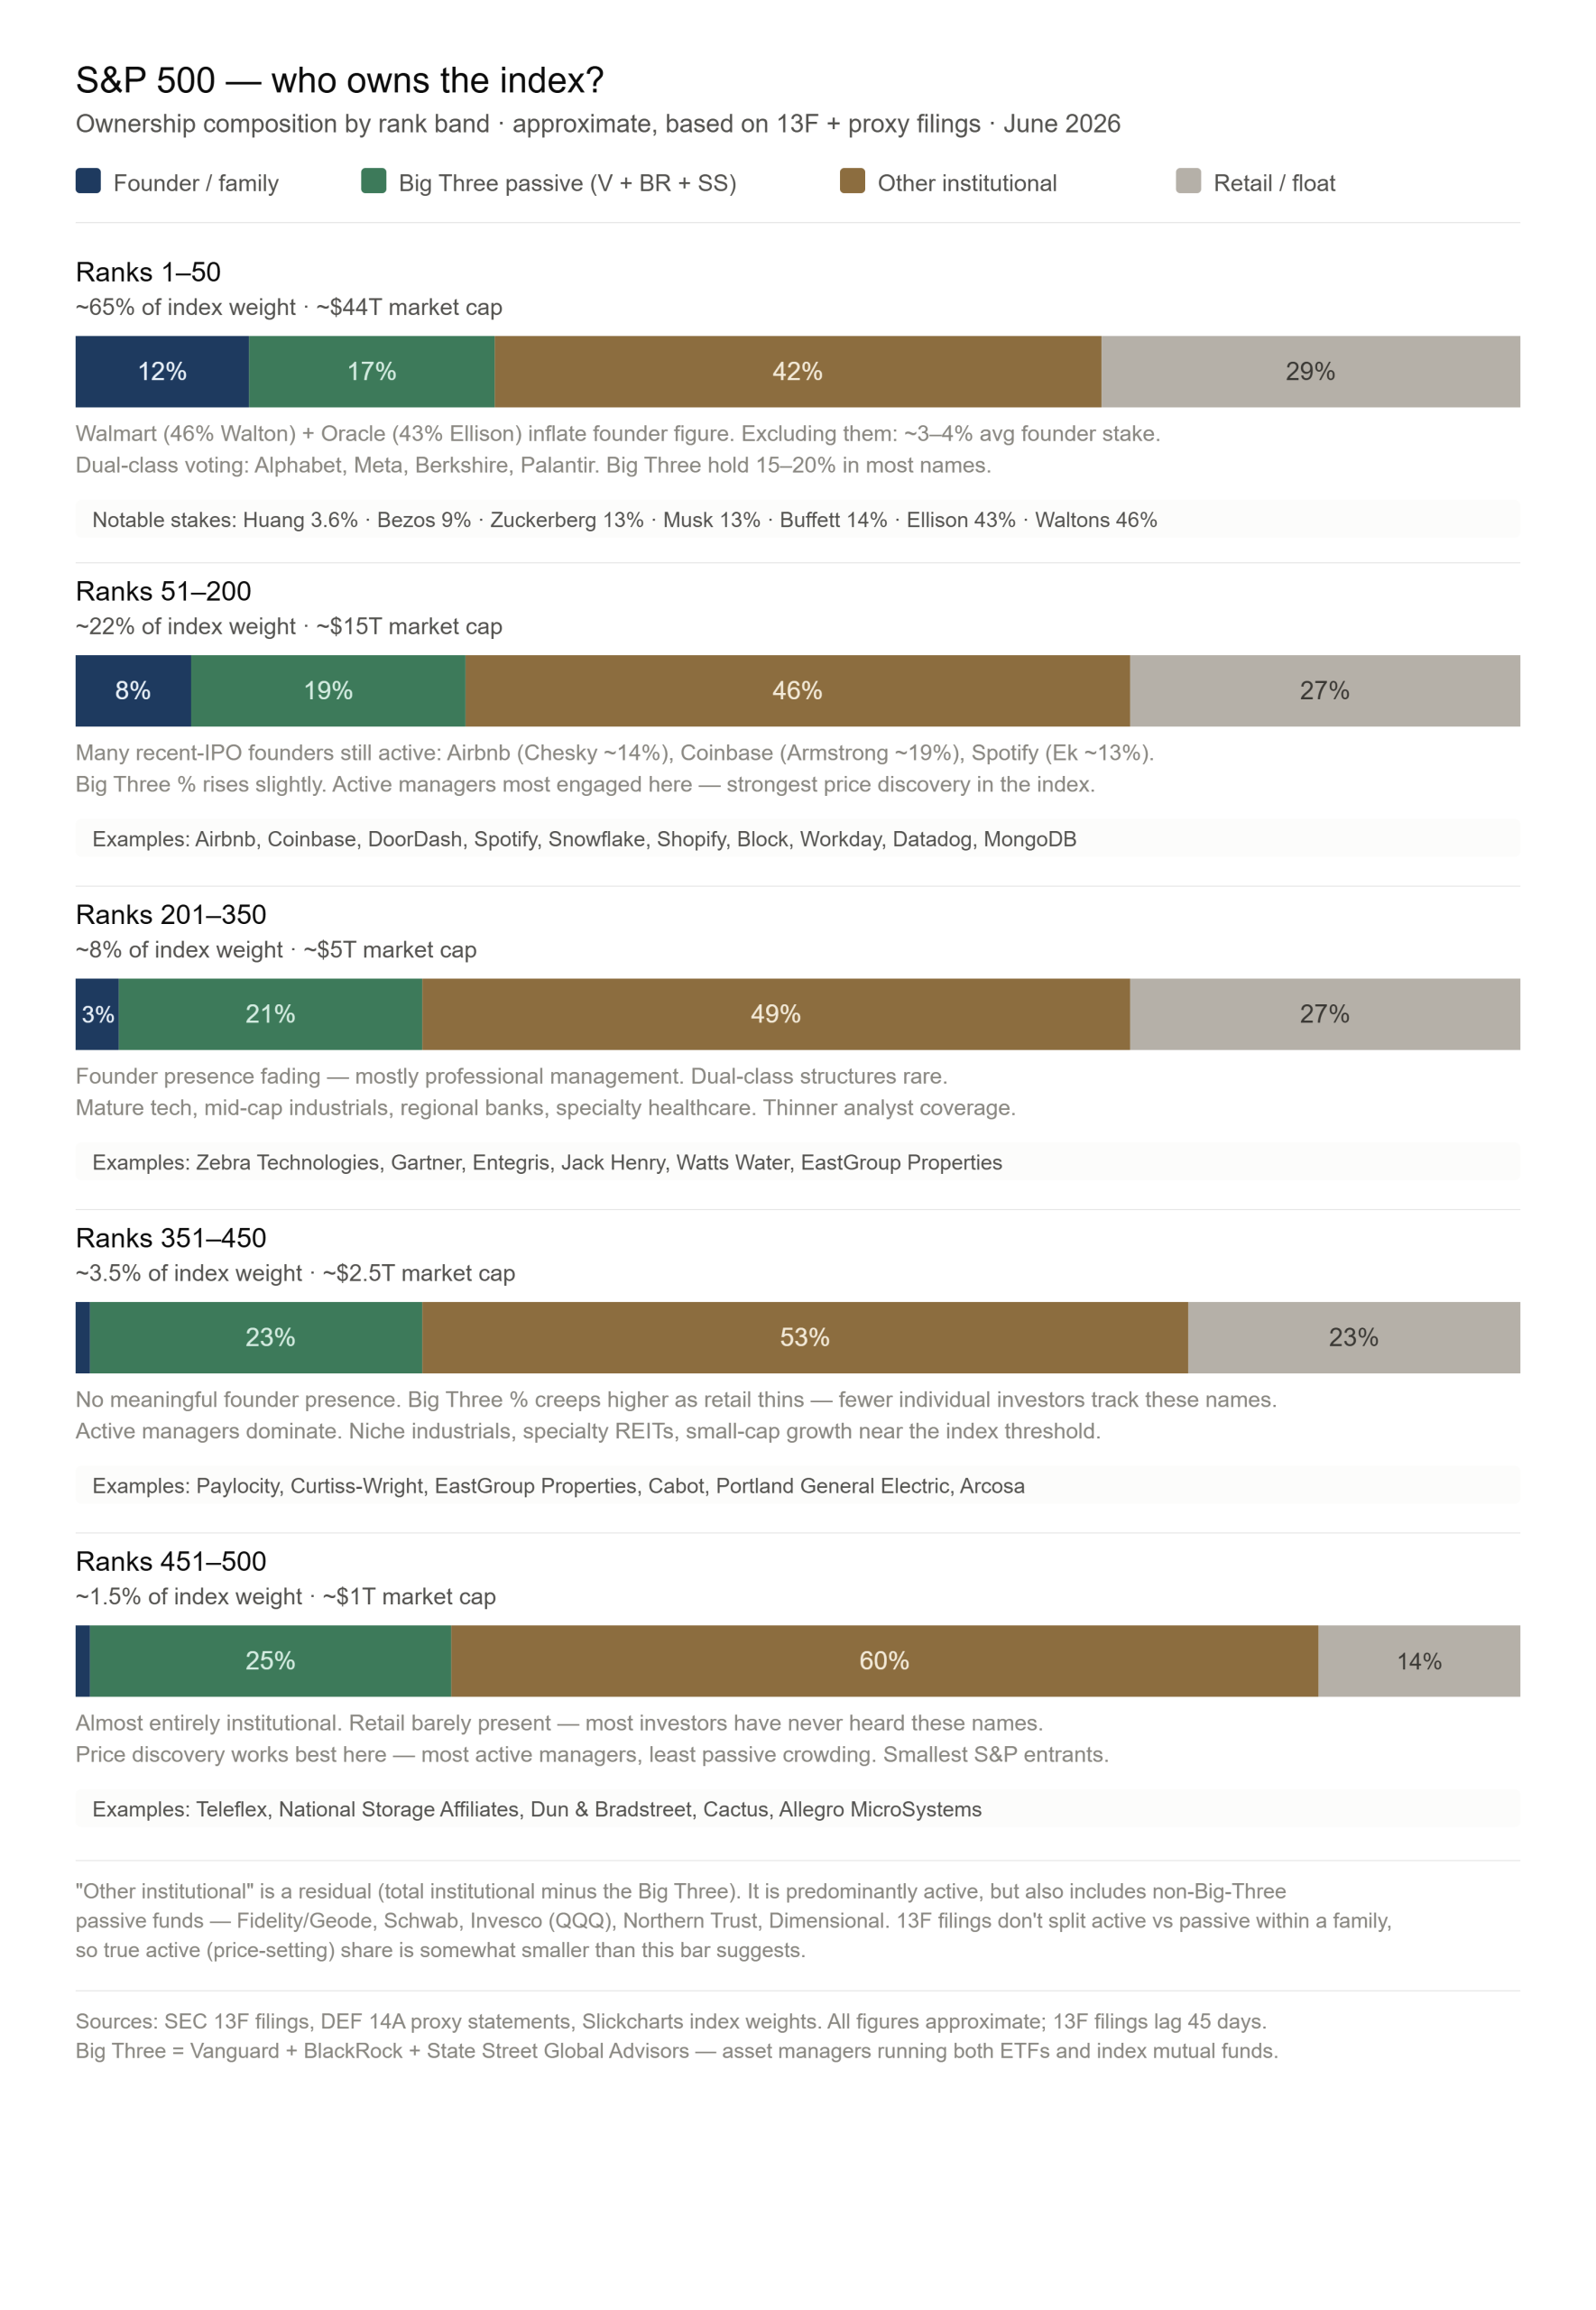
- Three asset managers — BlackRock, Vanguard, and State Street — now collectively manage approximately $23–25 trillion in assets. They are among the top three shareholders in roughly 90% of S&P 500 companies simultaneously
- As of 2019: “Among other things, the Big Three have almost quadrupled (see chart) their collective ownership stake in S&P 500 companies over the past two decades; that they have captured the overwhelming majority of the inflows into the asset management industry over the past decade; that each of them now manages 5% or more of the shares in a vast number of public companies; and that they collectively cast an average of about 25% of the votes at S&P 500 companies.” (from here)
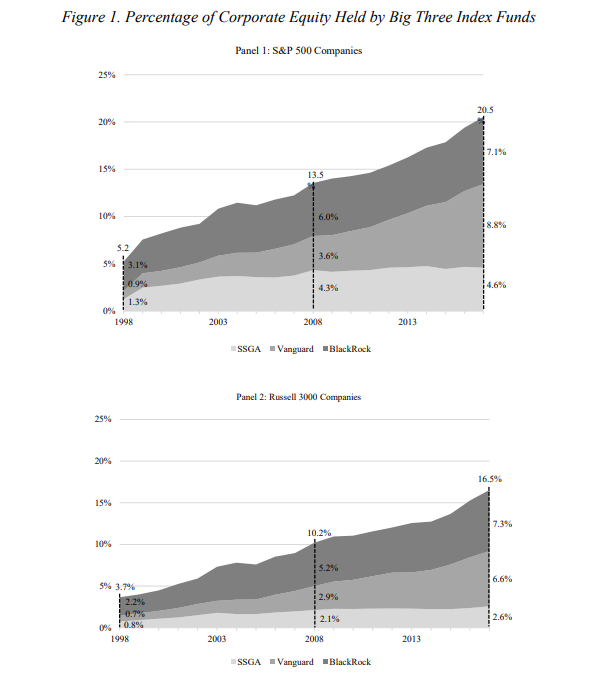
- It has only grown further since 2019.
- As of 2019: “Among other things, the Big Three have almost quadrupled (see chart) their collective ownership stake in S&P 500 companies over the past two decades; that they have captured the overwhelming majority of the inflows into the asset management industry over the past decade; that each of them now manages 5% or more of the shares in a vast number of public companies; and that they collectively cast an average of about 25% of the votes at S&P 500 companies.” (from here)
- Overall institutional ownership accounts for 70-80% of the S&P 500.
- Consider this for a moment in light of price discovery, market, decision making at companies.
- A couple of points about the broader US equity markets (including beyond S&P 500):
- As of 2013, the top 1% of US households owned 38% of the stock market wealth. The top 10% owned 81%, the next 10% owned 11%, and the bottom 80% owned just 8%
- Foreign investors own 18% of US equities outstanding as of 2024, with holdings by advanced foreign economies totalling $13 trillion of US equities
- A significant portion of the household equity in the markets is retirement savings invested in Equity Mutual Funds and ETFs.
- ETFs |ETFs are Exchange Traded Funds
- 20 years ago (c. 2006), the global market cap was close to $50-54 trillion. And the global total ETF AUM was at $ 550-$600 billion, a fraction of world’s equity.
- In 2026, the global market cap is close to $130 trillion (by some sources), and global ETF AUM is at $20-21 trillion (for an indication of trend, see the following chart). Equity ETFs are roughly $16–17 trillion of the $21 trillion
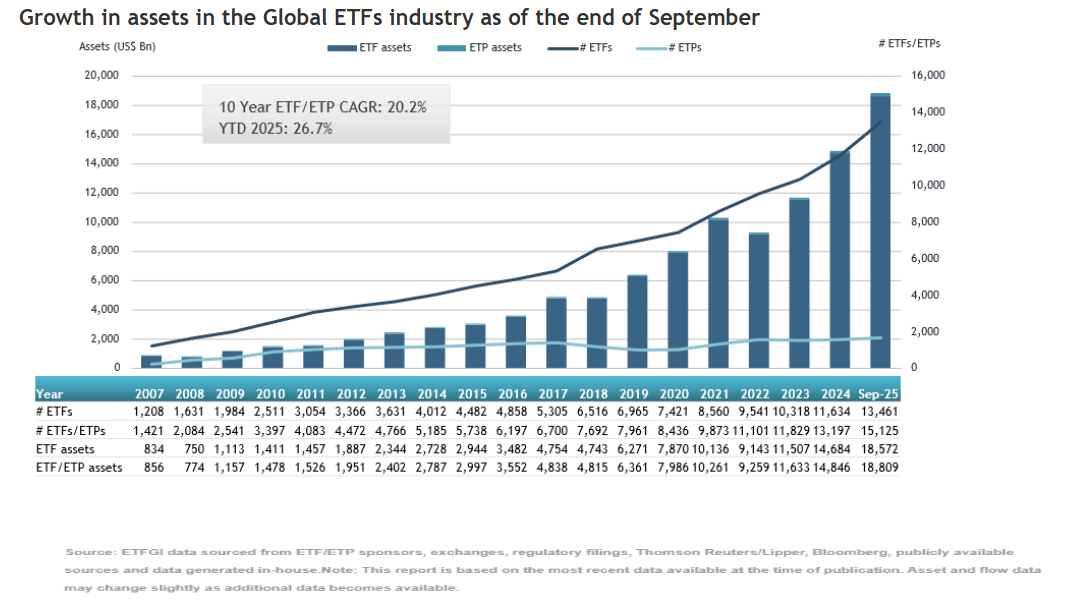
- ETF AUM expected to surpass $33 trillion by 2030 (see the following chart, from here)
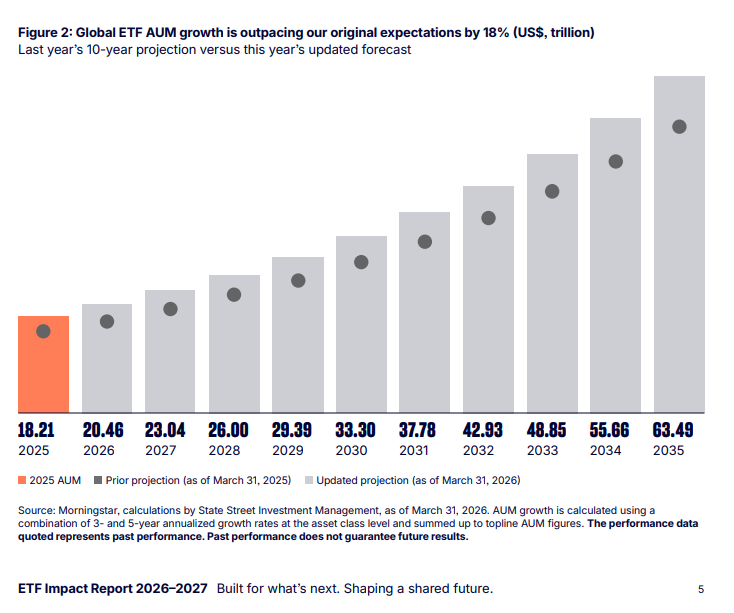
- In 2006, the S&P 500 was valued at around $12-13 trillion and US ETF assets were approximately $400 billion. By 2026, the S&P 500 has grown to $67 trillion, while US ETF assets are $13+ trillion, nearly 20% of the index. The index itself is now over 54% of the entire global equity market.
A QUESTION TO PONDER – WHAT IS A MARKET?
All the above raises further the point of what exactly is the function of a market. And the related question of passive investing, value discovery, valuation multiples, institutional ownership, governance of companies and their decision making.
For instance, consider this: Passive funds closed 2023 with more US assets than active funds for the first time (see the following chart). “Passive investing has grown significantly over the past three decades, accounting for 50% of total equity investing in mutual funds and ETFs globally today.” (Source).
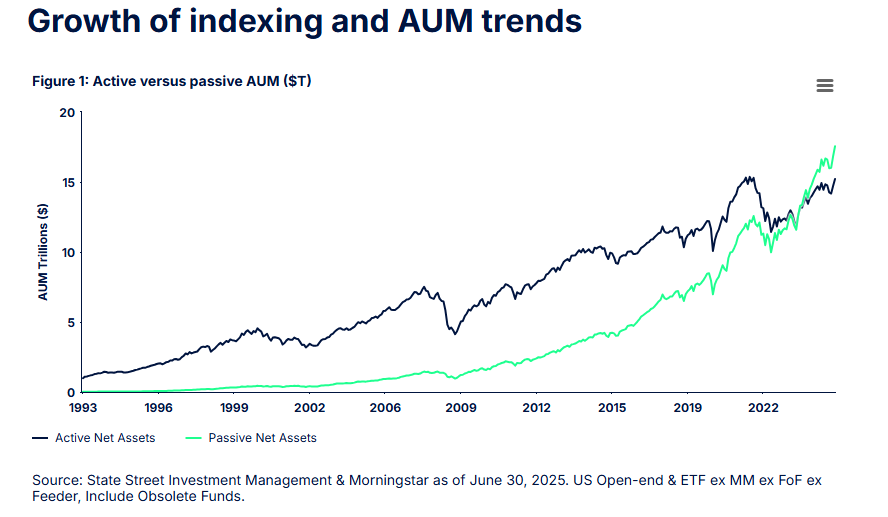
This is a structural crossing point, not just a flow trend. Once passive exceeds 50%, the market’s price discovery mechanism is being sustained by a minority of participants.
To further consider the implications, here attached is a deep-dive essay explored with AI on the impact of passive investing on markets.
Eventually, it is a question about price discovery of assets, about information in the market. And if more and more of the market becomes price-taker, who is setting the prices?
Other Readings:
- As to how an index is constructed, and the consideration around upcoming inclusions, here is a post from the internet (Aswath Damodaran).